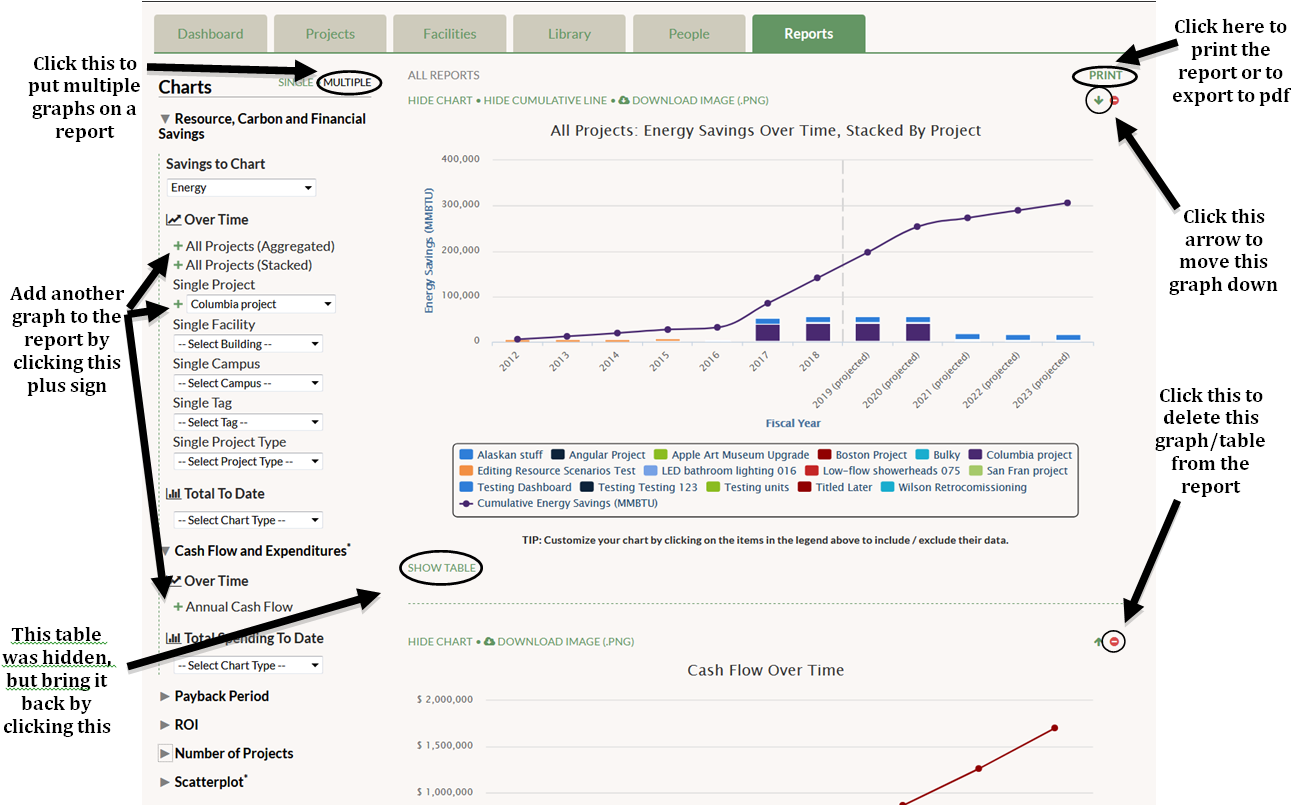
After you have decided which graphs and tables to include in your report and the order they will appear, you can click “Print” in the upper-right corner to print all of these charts in one document. You may end up printing a multi-page report. If you have PDF creation capabilities on your computer, you will be able to export this report to a PDF file.
GRITS Guide
⌘K
- Getting Started
- GRITS Guide Overview
- Dashboard
- Settings Page
- Basic Information
- Primary Campus
- Fiscal Year Calendar
- Discount Rate
- Currency
- Custom Carbon Emissions Factors
- Social Cost of Carbon
- Custom Resource Price Forecasts
- Project-level Sharing
- Public Library
- Embeddable Public Dashboard
- Manage Tags
- Energy, Water, and Waste Units
- Customize Average Calculation (Median or Mean)
- Projects Tab
- Project Details Page
- Add a New Project
- Archive a Project
- Adjust for Yearly Savings/Price Changes
- Change Resource Units
- Copy a Project
- Tag a Project
- Apply a Social Cost of Carbon
- Apply Custom Carbon Emissions
- Apply Resource Price Forecasts
- View Energy, Financial, and Carbon Savings
- View Financial Metrics
- Manage Project Financial Transactions
- Required Fields and Project Validation
- Add Notes, Attachments, Or Cover Photo
- Export Project to PDF
- Share Project via Custom URL
- Share Project via Public Library
- Share Project via Embeddable Project Profile
- Facilities Tab
- Consumption Tab
- Library
- Reports
- Goals Tab
- Notification Center
- Home
- GRITS Guide
- Reports
- Print or Export Reports to PDF