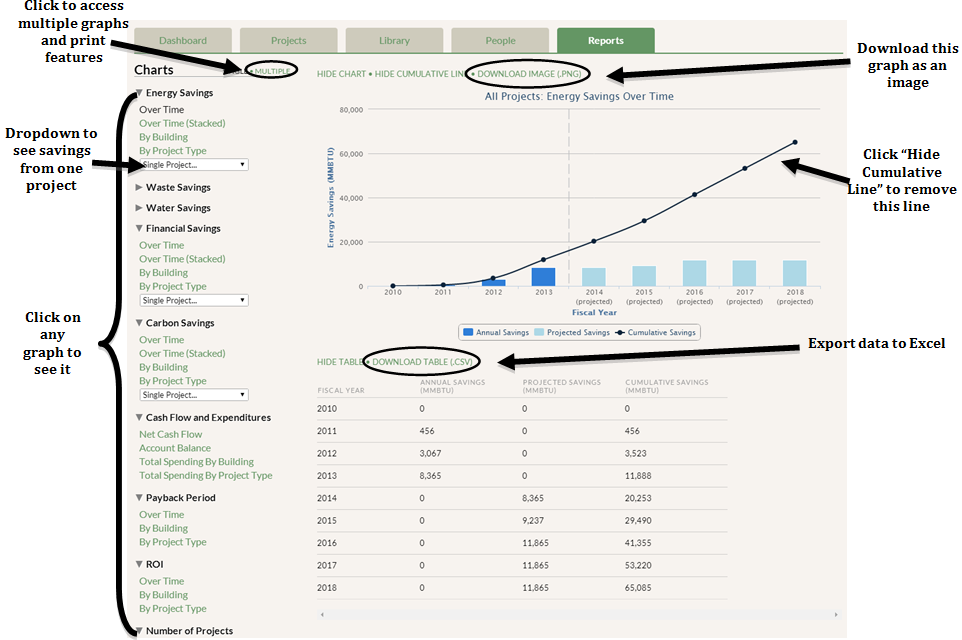
To download an image of just the graph, not including the table, click on “Download Image (.PNG)”, which appears in green text above each graph. You could print this single image once downloaded. Please note that you should make all adjustments to your desired graph before downloading the image, since you will not be able to edit the downloaded PNG file.
GRITS Guide
⌘K
- Getting Started
- GRITS Guide Overview
- Dashboard
- Settings Page
- Basic Information
- Primary Campus
- Fiscal Year Calendar
- Discount Rate
- Currency
- Custom Carbon Emissions Factors
- Social Cost of Carbon
- Custom Resource Price Forecasts
- Project-level Sharing
- Public Library
- Embeddable Public Dashboard
- Manage Tags
- Energy, Water, and Waste Units
- Customize Average Calculation (Median or Mean)
- Projects Tab
- Project Details Page
- Add a New Project
- Archive a Project
- Adjust for Yearly Savings/Price Changes
- Change Resource Units
- Copy a Project
- Tag a Project
- Apply a Social Cost of Carbon
- Apply Custom Carbon Emissions
- Apply Resource Price Forecasts
- View Energy, Financial, and Carbon Savings
- View Financial Metrics
- Manage Project Financial Transactions
- Required Fields and Project Validation
- Add Notes, Attachments, Or Cover Photo
- Export Project to PDF
- Share Project via Custom URL
- Share Project via Public Library
- Share Project via Embeddable Project Profile
- Facilities Tab
- Consumption Tab
- Library
- Reports
- Goals Tab
- Front Page
- Goal Page
- Scenario Page – Scenario Context and Selecting Projects
- Scenario Page – Chart
- Scenario Page – Chart Table
- Scenario Page – Project Timeline
- Scenario Page – Progress Metrics
- Scenario Page – Impacts
- Scenario Page – Finances
- Scenario Page – Annual Cash Flow
- Scenario Page – Implemented Plans
- Scenario Page – Embeddable Scenario Dashboard
- Notification Center
- Home
- GRITS Guide
- Reports
- Download Graphs