(This feature is only available to GRITS Unlimited users.)
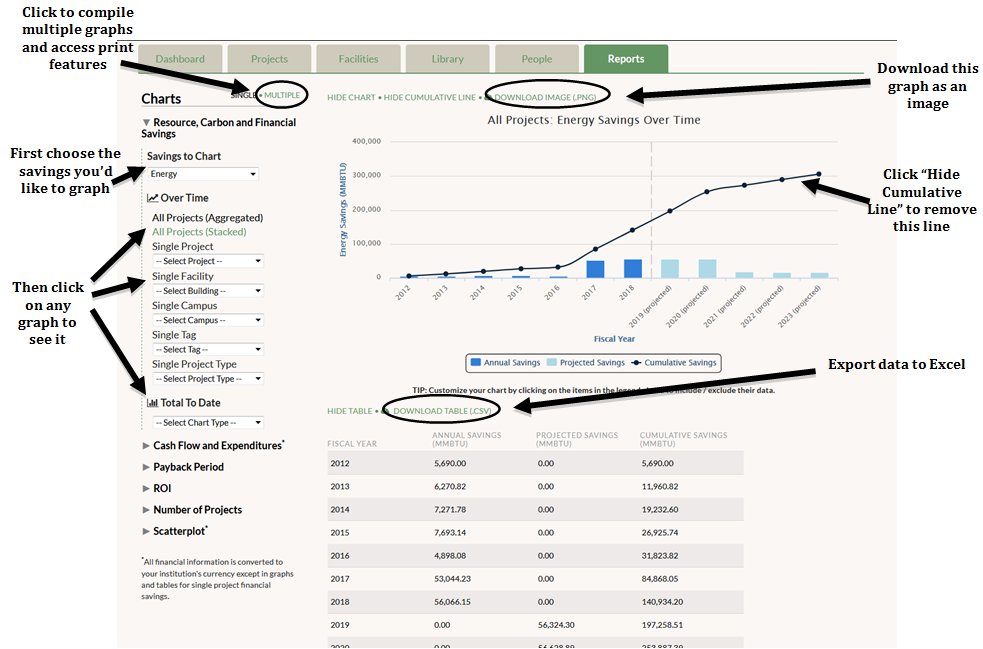
The Reports tab is where you can create a variety of different types of graphs and charts that visually display different aspects of your project-specific and aggregate portfolio data. The Reports feature also allows for data export to Excel, report print-outs with multiple graphs and tables, and creating report PDF files.