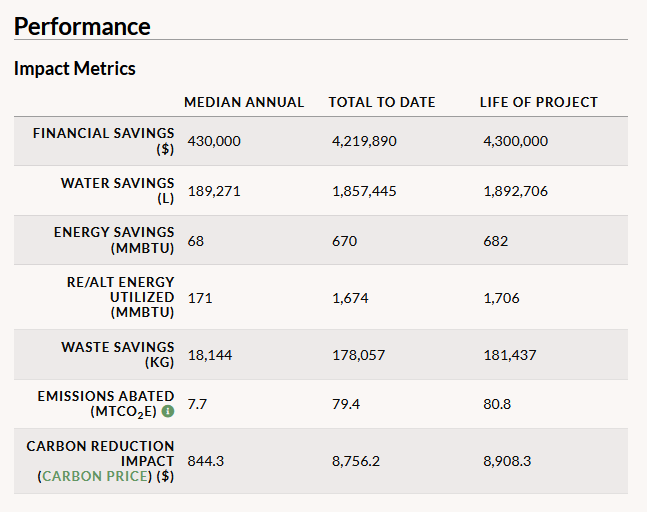
On the right side of the Project Details page, you will see an Impact Metrics table with calculations made by GRITS that illustrate your project’s savings and other impacts.
Depending on the kinds of resources you’ve entered under your project’s “Resources Tracked” section, you will see metrics for resource savings (energy, water, and waste), financial savings (in your campus’s currency), emissions abated (in million metric tons of carbon dioxide equivalent emissions), and other impacts described below. These impacts are calculated over various timeframes: the median/average annual, the total impact to date since the project’s install start date, and the total impact estimated over the project’s lifespan.
- Emissions savings are based on the default emissions factors for the resources saved by your project, but if you’ve applied custom emissions factors to the project’s campus or to the project itself via its Custom Settings sub-tab, those will be used instead.
- “RE/Alt Energy Utilized” refers to the amount of renewable or alternative energy generated or used by your project, based on the resources you’ve entered under the “RE/Alt energy” resource type (a designation you’ll only see if the project has a “Renewable or Alternative Energy” project type).
- “Carbon Reduction Impact” refers to the estimated financial benefit of the emissions reduced by your project, based on the social cost of carbon framework you have applied to it.

