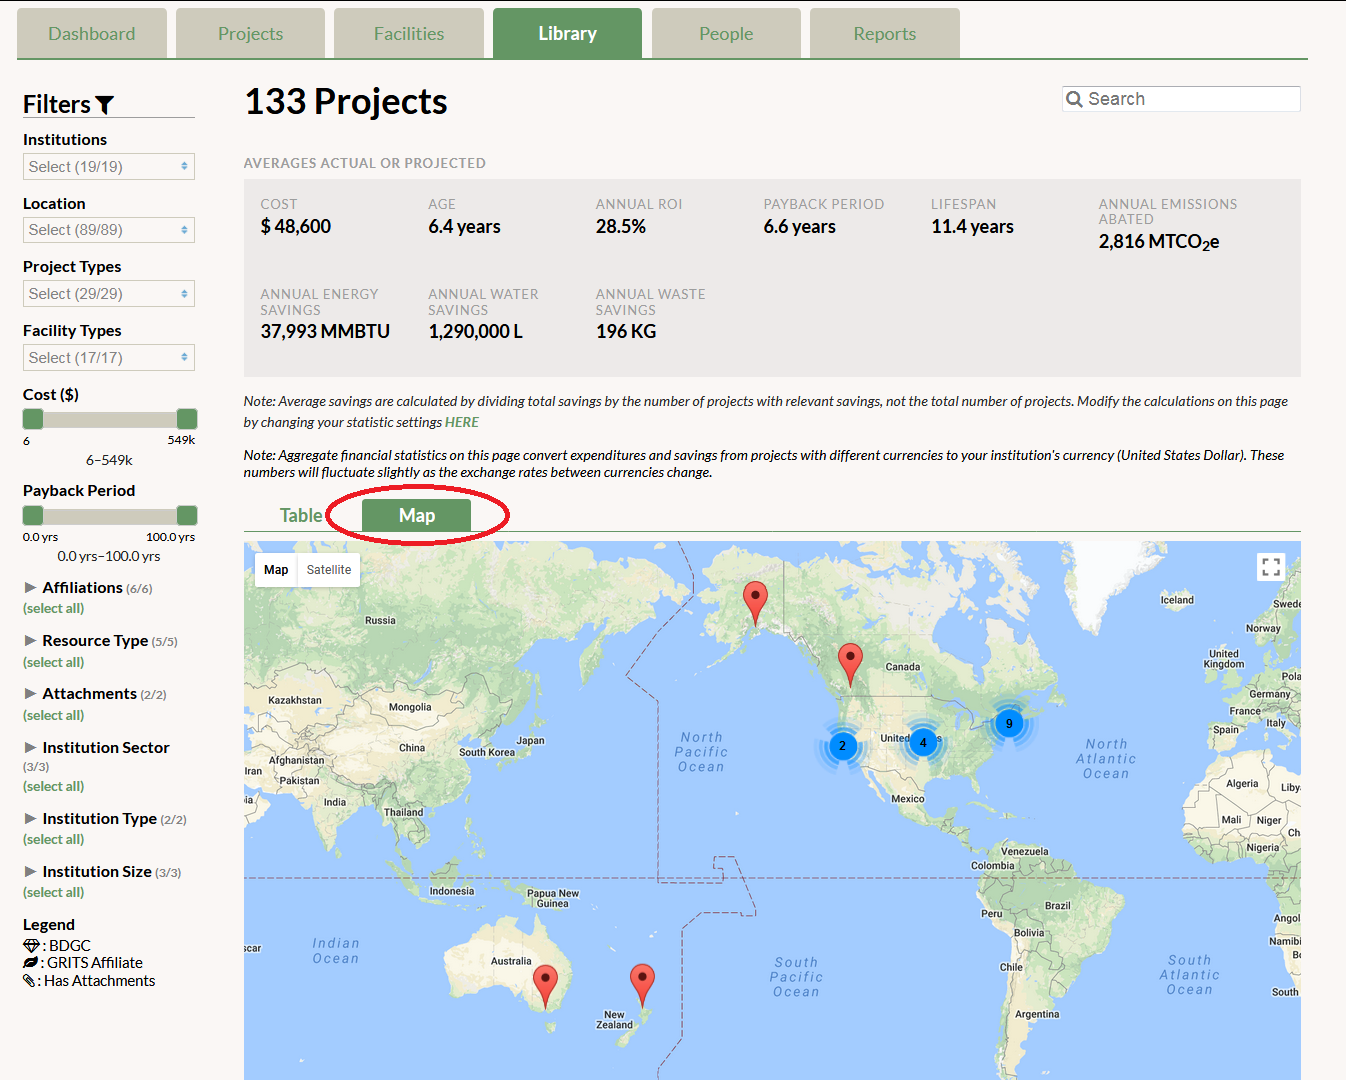
To the right of the word “Table” on the lower part of the Library page, you will see another small tab called “Map”. By clicking on it you will see the geographical location of all institutions that have projects in the Library, with a red pinpoint indicating each campus. By clicking on the red pinpoint you will see how many projects in the Library are from that campus. If you have used the Library filters, you will only see the projects and campuses that meet your search criteria in the map. When you first open the map, you may see blue and yellow circles with numbers in them. The circles indicate that there are many campuses in that region, so if you click on the circle you will zoom into that region for a closer look. The map appears in a Google Maps format.
GRITS Guide
⌘K
- Getting Started
- GRITS Guide Overview
- Dashboard
- Settings Page
- Basic Information
- Primary Campus
- Fiscal Year Calendar
- Discount Rate
- Currency
- Custom Carbon Emissions Factors
- Social Cost of Carbon
- Custom Resource Price Forecasts
- Project-level Sharing
- Public Library
- Embeddable Public Dashboard
- Manage Tags
- Energy, Water, and Waste Units
- Customize Average Calculation (Median or Mean)
- Projects Tab
- Project Details Page
- Add a New Project
- Archive a Project
- Adjust for Yearly Savings/Price Changes
- Change Resource Units
- Copy a Project
- Tag a Project
- Apply a Social Cost of Carbon
- Apply Custom Carbon Emissions
- Apply Resource Price Forecasts
- View Energy, Financial, and Carbon Savings
- View Financial Metrics
- Manage Project Financial Transactions
- Required Fields and Project Validation
- Add Notes, Attachments, Or Cover Photo
- Export Project to PDF
- Share Project via Custom URL
- Share Project via Public Library
- Share Project via Embeddable Project Profile
- Facilities Tab
- Consumption Tab
- Library
- Reports
- Goals Tab
- Notification Center
- Home
- GRITS Guide
- Library
- View a Map of Projects