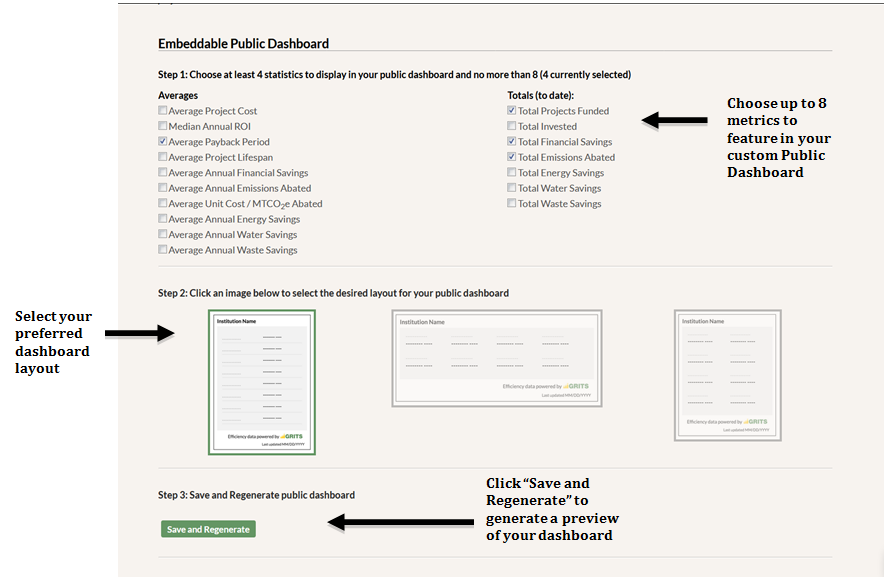
Under the Sharing sub-tab you can also design a dashboard with several GRITS metrics that you can embed in your institution’s website. Scroll down to the Public Dashboard section and choose between four and eight metrics that you would like to display. These are calculated from projects marked as Completed unless otherwise stated. Then select the preferred layout. Finally, click the “Save and Regenerate” button.

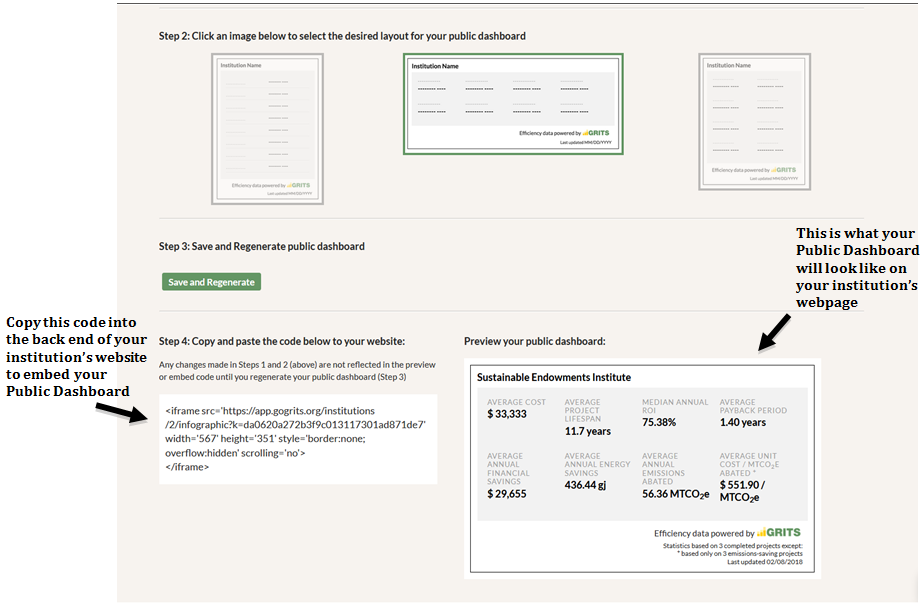
A preview of your Public Dashboard will be shown below. Copy the code to the left and embed it into your website to display the Dashboard and share the impact of your GRITS projects. The Dashboard is refreshed every 45 minutes to reflect any updates to the metrics you’ve selected.

