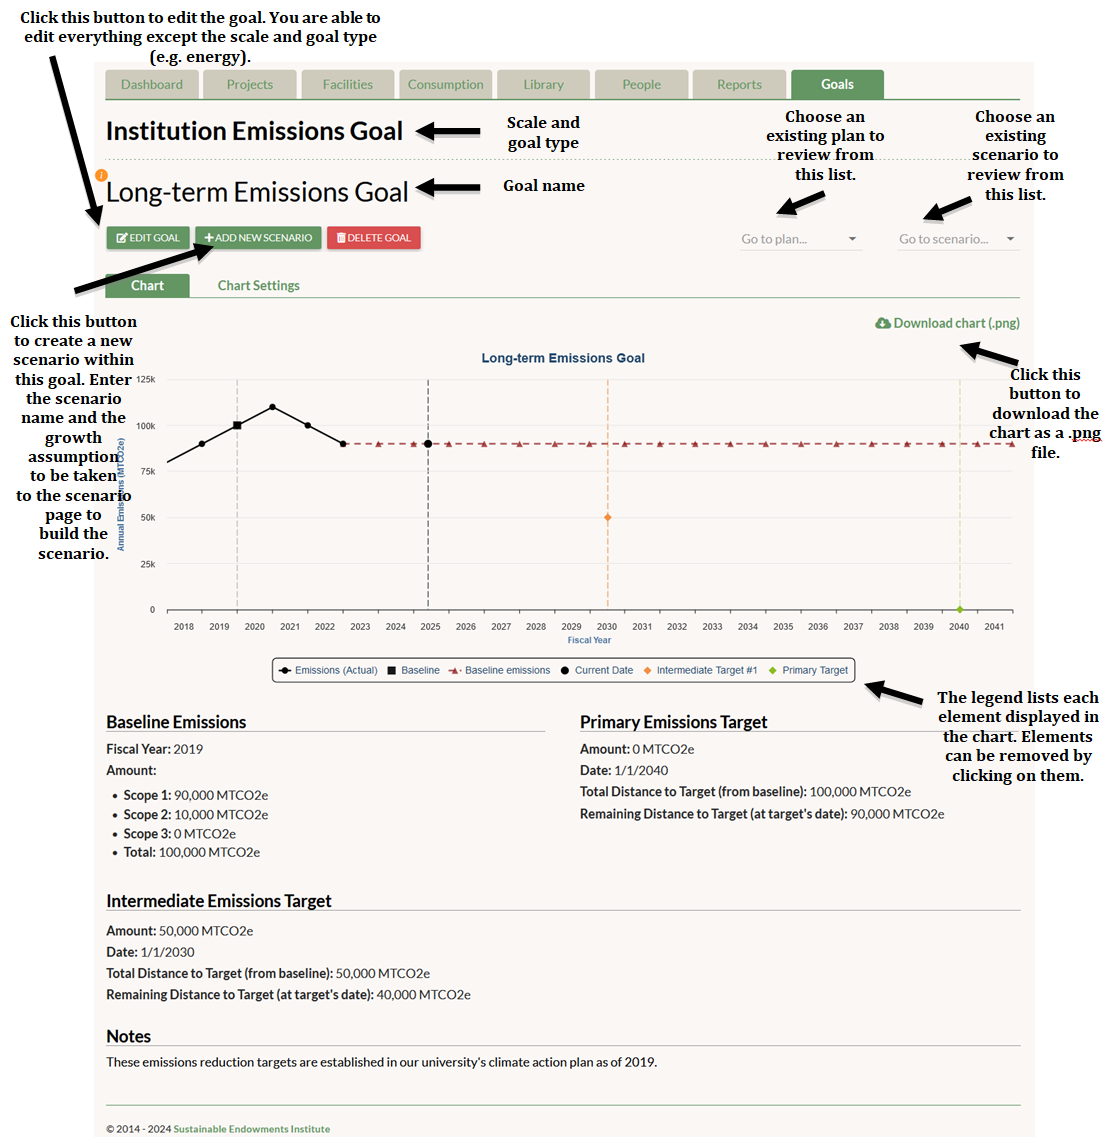
When you save your goal, you’ll be taken to the Goal page where you can see the parameters of your goal presented in chart form.
The chart will show past consumption data when it’s available. You can see a non-growing business-as-usual projection extending from the last available consumption data point as well as your intermediate and primary targets. Hover your cursor over each item to see the day or fiscal year they fall on, and the resource consumption or emissions rate projected at that time. All of the chart elements appear in the legend below the chart, and clicking on any of them will remove them from the chart.
The Chart Settings sub-tab allows you to toggle on or off the business-as-usual projection and the emissions scopes (only shown for emissions reduction goals). When switched off, an element won’t appear in the chart or in the chart legend. These settings can be helpful if you want to download the chart without certain elements in the chart legend below.
Use the “Download chart (.png)” button to generate and download a png image of the chart.
The area below the chart displays the goal’s baseline and target information, as well as any notes.
If you need to change aspects of your goal, you can do so by clicking the “Edit Goal” button. You are able to edit everything except for the scale (e.g. institution-level versus building-level) and goal type (e.g. emissions reduction versus energy reduction).
You are able to delete the goal by clicking the “Delete Goal” button. CAUTION: This will also delete all scenarios and plans associated with this goal. A popup will appear to let you know how many scenarios and plans would be deleted and ask you to confirm deletion.

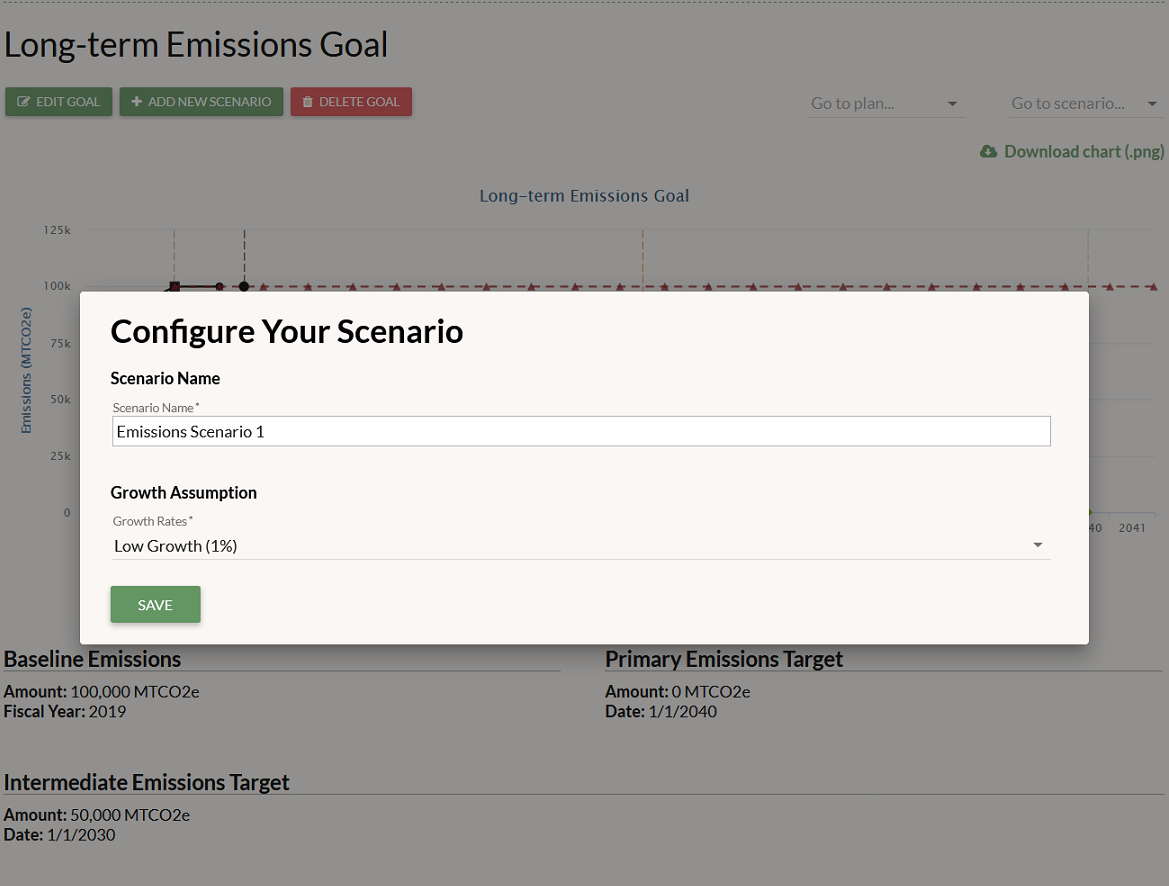
Click the “Add New Scenario” button to start building potential pathways between your baseline and your targets. You can create an unlimited number of scenarios to figure out the best way to achieve your goal. Only two fields must be filled out before you are brought to the Scenario page to begin customizing your pathway: the scenario name and the growth assumption. The growth assumption is the rate at which you expect your institution, campus/site, or facility to expand each year. The growth rate determines how the consumption/emissions projections that appear in the chart on the Scenario page increase over time.
You can load existing scenarios or plans via the drop-down lists that appear above and to the right of the chart. (Note that if you have not created any scenarios then no lists will appear on the page. If you have not marked any scenarios as implemented plans then a plan list will not appear.)

