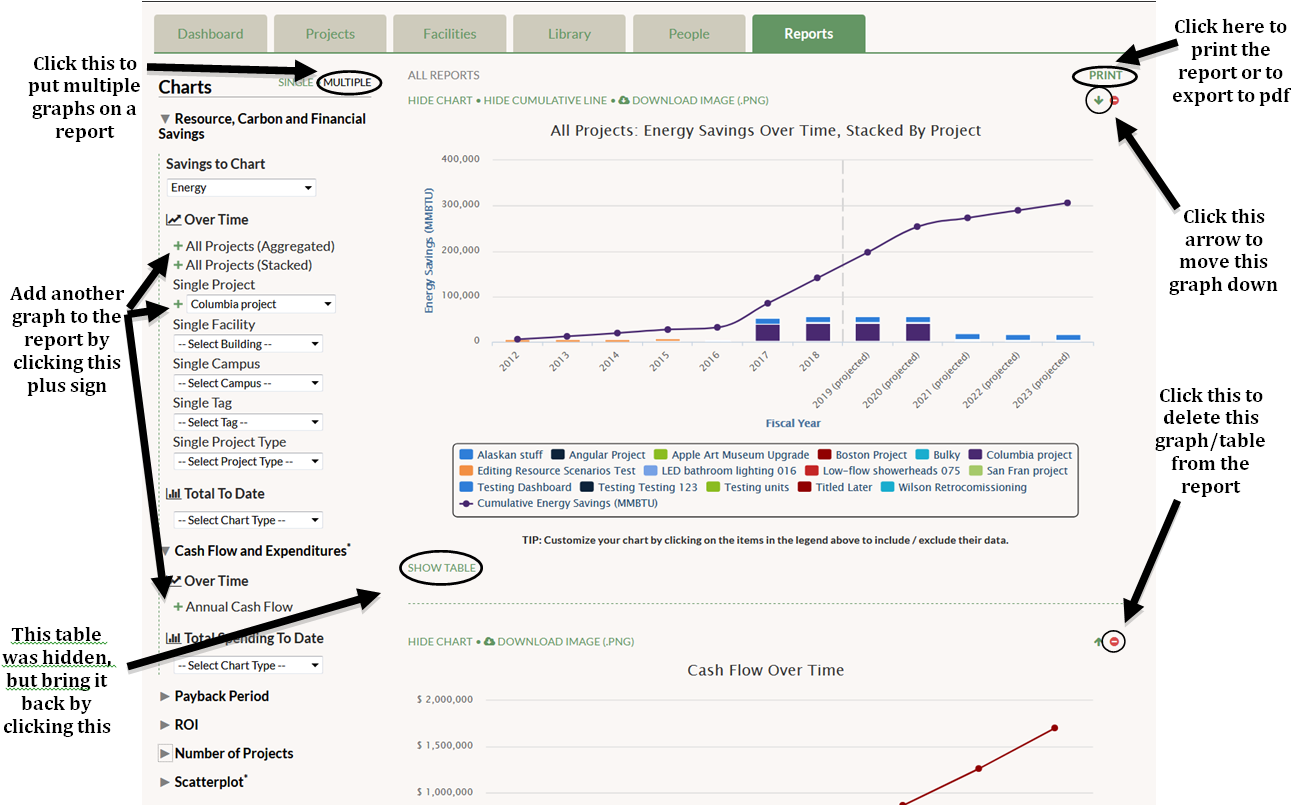
Near the top of the page, to the right of “Charts” you will see “Single” and “Multiple” as two different options. When you arrive on the Reports tab, you automatically view Single graph mode. To place multiple graphs into a printable report, click “Multiple”. Once in Multiple mode, select the graphs you want in your report. To add graphs, click on the green plus sign by each graph. When you add a new graph, it will be placed at the bottom of the page. If you want to add a Single Project graph or a scatterplot, choose from the dropdown menu first and then click the green plus sign to add it.
You can customize the report by choosing to hide certain tables by clicking “Hide Table.” Perhaps you only want a report full of tables, without graphs. In that case, click “Hide Chart” on each graph. If you want to delete one of the graphs or tables from the report, click the red dot in the upper right corner by that graph or table. You can change the order of graphs and tables by clicking the green up/down arrows in the upper right corner by that graph.

