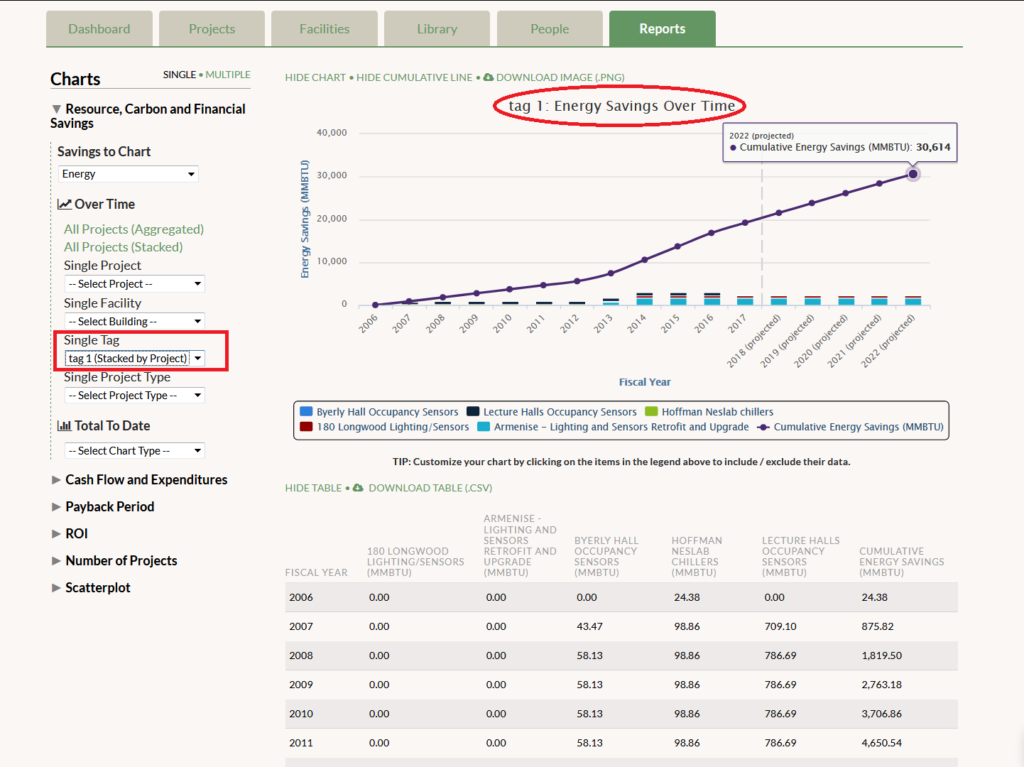
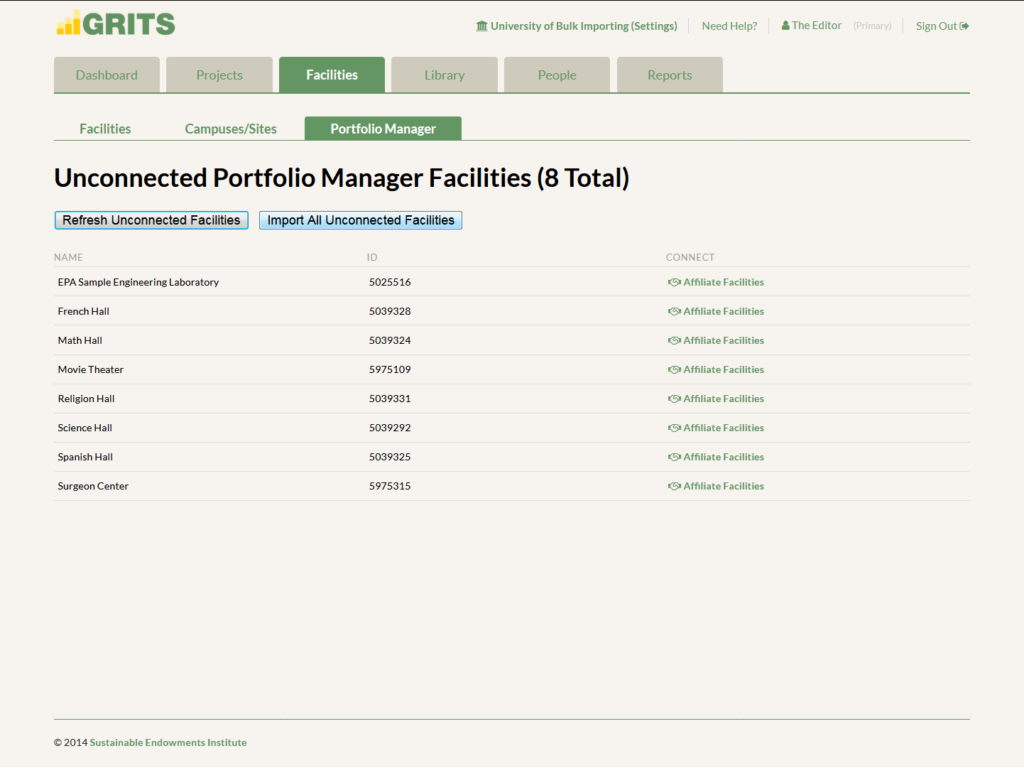
We are excited to launch GRITS 2.0, which includes a host of new sharing features (project-level sharing, a Public Library, and an embeddable Public Dashboard), integration with EPA’s Portfolio Manager tool, currency conversion, and several other additions. Log in to GRITS now to see these new features in action! Expanding the GRITS Universe Two new locations have been added to GRITS—Australia and New Zealand! We welcome several new users, including Australia’s foremost research universities: the Group of Eight. For all other users, you can use the location filter or the map in the Library to find projects completed by these institutions to compare against your own. Custom Currencies As GRITS’ geographical location expands, so has the need for different currencies. All GRITS institutions are now configured to enter financial data in their country’s currency, and GRITS converts to your own currency when you view projects in the Library from different countries. You can view your institution’s currency on the Settings page. If your institution has campuses that operate outside of your country, you can also customize the currency of each campus and make it the default for all projects linked to that campus. View campus-level savings graphs If your institution oversees multiple campuses/sites, you’re now able to generate campus/site-specific graphs in the Reports tab. Use this option to see the energy, financial, and carbon savings achieved for each location’s group of buildings. Import facilities from Portfolio Manager If you use the EPA’s Portfolio Manager tool to track building data, you can now import those buildings and their basic characteristics into GRITS. You can find the new “Portfolio Manager” sub-tab under the Facilities tab, where there are instructions for connecting your account to GRITS. After sending a successful connection request and sharing your facility information, you can choose to import buildings into GRITS one-by-one or in bulk—saving significant time. Step 1: Log into your Portfolio Manager account. Step 2: Click the “Contacts” link at the top right-hand corner of the page (next to “Help | Sign Out”). Step 3: Search for “GRITS” in the search bar, then click “connect.” Step 4: Let us know you’re trying to connect by emailing support@gogrits.org (we check for new connection requests regularly, but this will speed things up). Step 5: After we accept your request, share your Portfolio Manager properties with us. You will now be able to click the “load unaffiliated facilities” button in the “Portfolio Manager” sub-tab under the Facilities tab in GRITS. Click the “Import All Unconnected Facilities” button to import all buildings from Portfolio Manager. You can also use the “Affiliate Facilities” button to import individual buildings, and choose to create a new facility in GRITS or merge data from Portfolio Manager with an existing GRITS facility. Download facilities data You’re now able to download a spreadsheet all of your facility information from GRITS, including building name, type, and location. If you don’t currently use the EPA’s Portfolio Manager tool but plan to, you can use this spreadsheet to upload building data to the tool from GRITS. Public-facing features GRITS now has several features which enable users to share their project data with the public. Project Sharing: Choose to share individual projects with peers, administrators, or others who don’t have access to GRITS. Project-level sharing is enabled by default for your institution (toggle on the Settings page, under the “Sharing” sub-tab), and you can start sharing individual projects by switching it on within each Project Detail page. Flipping the sharing switch on your Project Detail page will reveal a customized link to your project that can be given to others, even those without access to GRITS, and can be switched off as desired. When at least one project is enabled for sharing, a new filter will appear on the Projects tab allowing you to isolate your sharing-enabled projects. Clicking the public URL will bring you to the public project page. Public Library: Choose to share your completed projects in a library visible to the public. Display your data and project achievements beyond GRITS, inspire others with ways to make their operations more efficient, and raise the profile of your institution. The Public Library is enabled by default for your institution (toggle on the Settings page, under the “Sharing” sub-tab), and you can start sharing individual projects by moving them from the Eligible Projects column to the Public Library Projects column. The projects will appear in the Public Library in two hours. Anyone can access the Public Library at: https://app.gogrits.org/library/public Public Dashboard: Design your own custom dashboard with several GRITS metrics that you can embed into your institution’s website. Navigate to the Settings page and the “Sharing” sub-tab, then scroll down to the Public Dashboard section. Choose between four and eight metrics that you would like to display in the Public Dashboard. These are calculated from the projects marked as Completed unless otherwise stated. Then select the preferred layout. Finally, click the “Save and Regenerate” button. A preview of your Public Dashboard is shown below. Copy the code to the left and embed it into your website to display the Dashboard and share the impact of your GRITS projects.