GRITS Goals Launched: A Powerful New Tool for Climate and Energy Action Planning
Today we are excited to officially launch GRITS 4.0, headlined by GRITS Goals! This suite of features adds an entirely new dimension to GRITS, empowering users to develop detailed plans to meet both short-term and long-term carbon reduction and other resource efficiency targets. Goals is by far the largest expansion of the platform since we released GRITS 1.0 back in 2014.
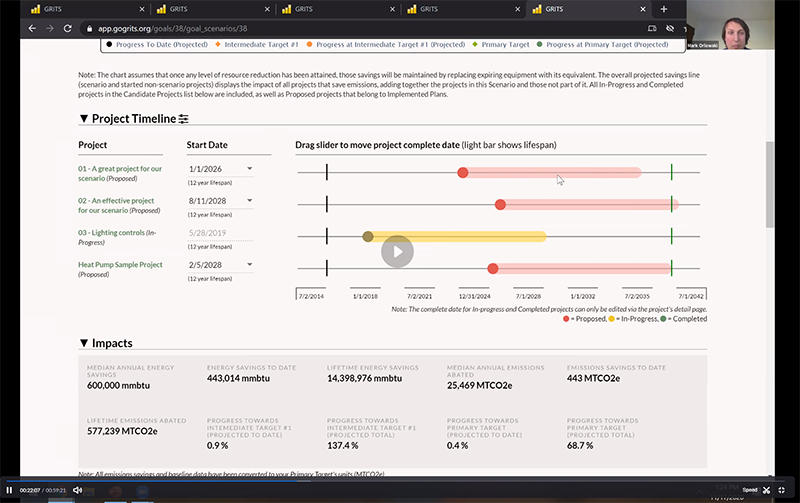
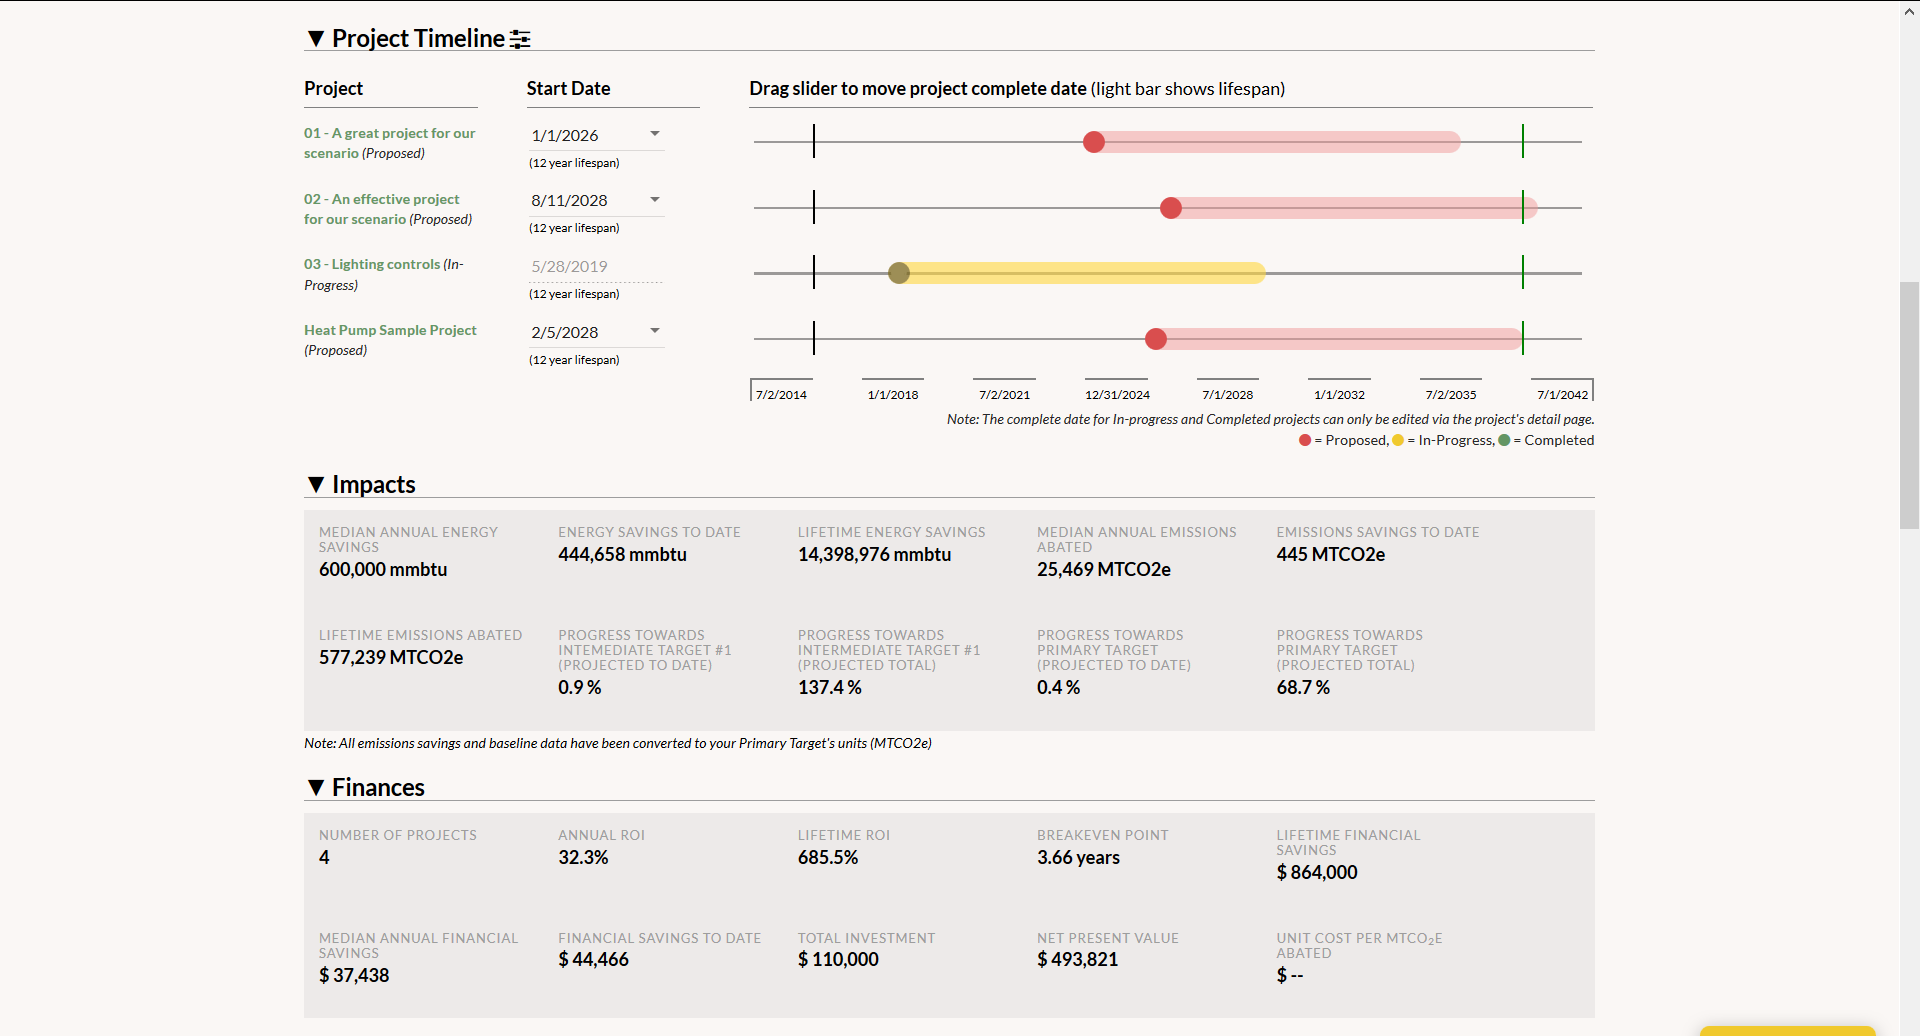
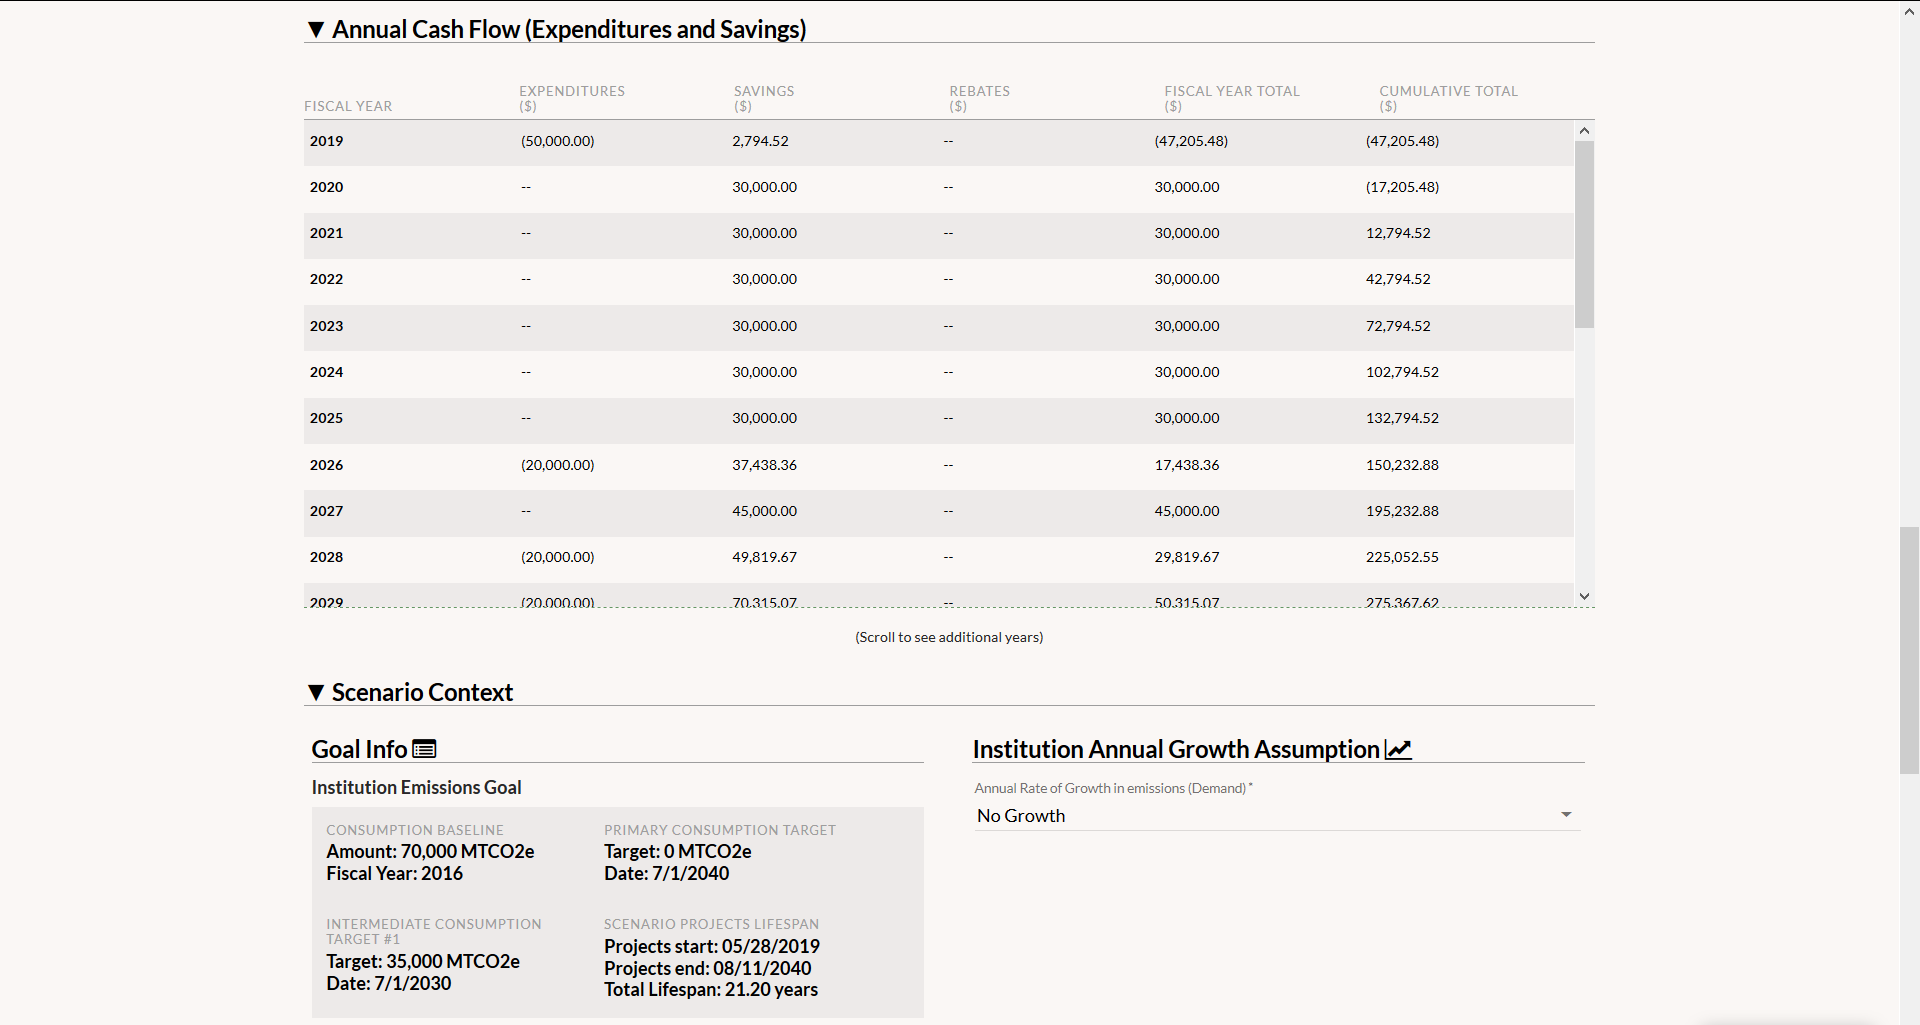
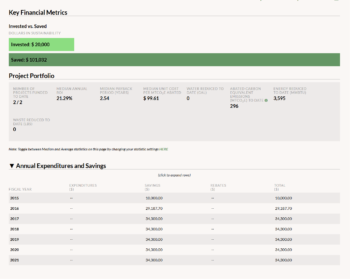
Users are now able to quickly build climate action plan models or track an existing plan's impacts by assembling their projects into resource reduction scenarios at the institution-wide, campus/site, or building scale. GRITS Goals combines the platform’s business case analysis with customizable project timelines and dynamic charting to map out pathways from business-as-usual to aggressive energy, carbon, water, or waste reduction targets. Users will see the scenario's environmental impacts like average annual carbon and energy savings alongside financial metrics such as return on investment and total lifetime cost savings.
Watch the GRITS Goals launch webinar recording to get a full walkthrough tour and insights into how GRITS Goals might help your institution. A case study on how Vassar College is using GRITS Goals is also featured during the webinar.
A huge thanks to our team (especially Aaron, Arvel and Deb), supporters, and users from over 800 institutions around the world that already use GRITS.
If you'd like to learn more or get access to GRITS Goals please contact us.
What's new in GRITS 4.0:
- Consumption tab
- Goals tab
- Goal Page
- Scenario Page
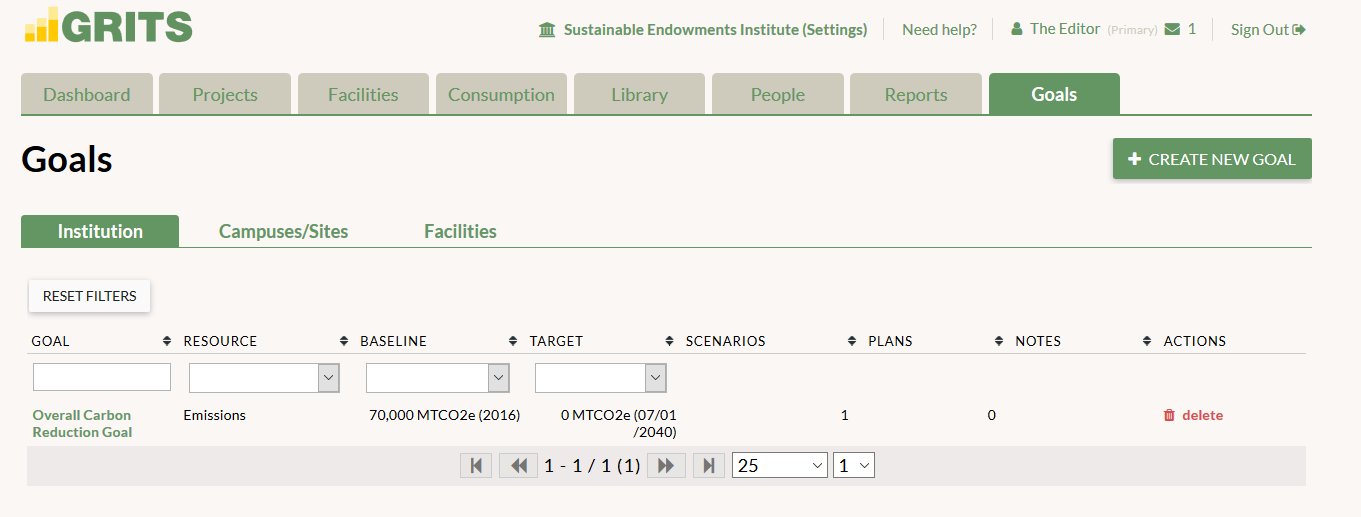
Consumption Tab
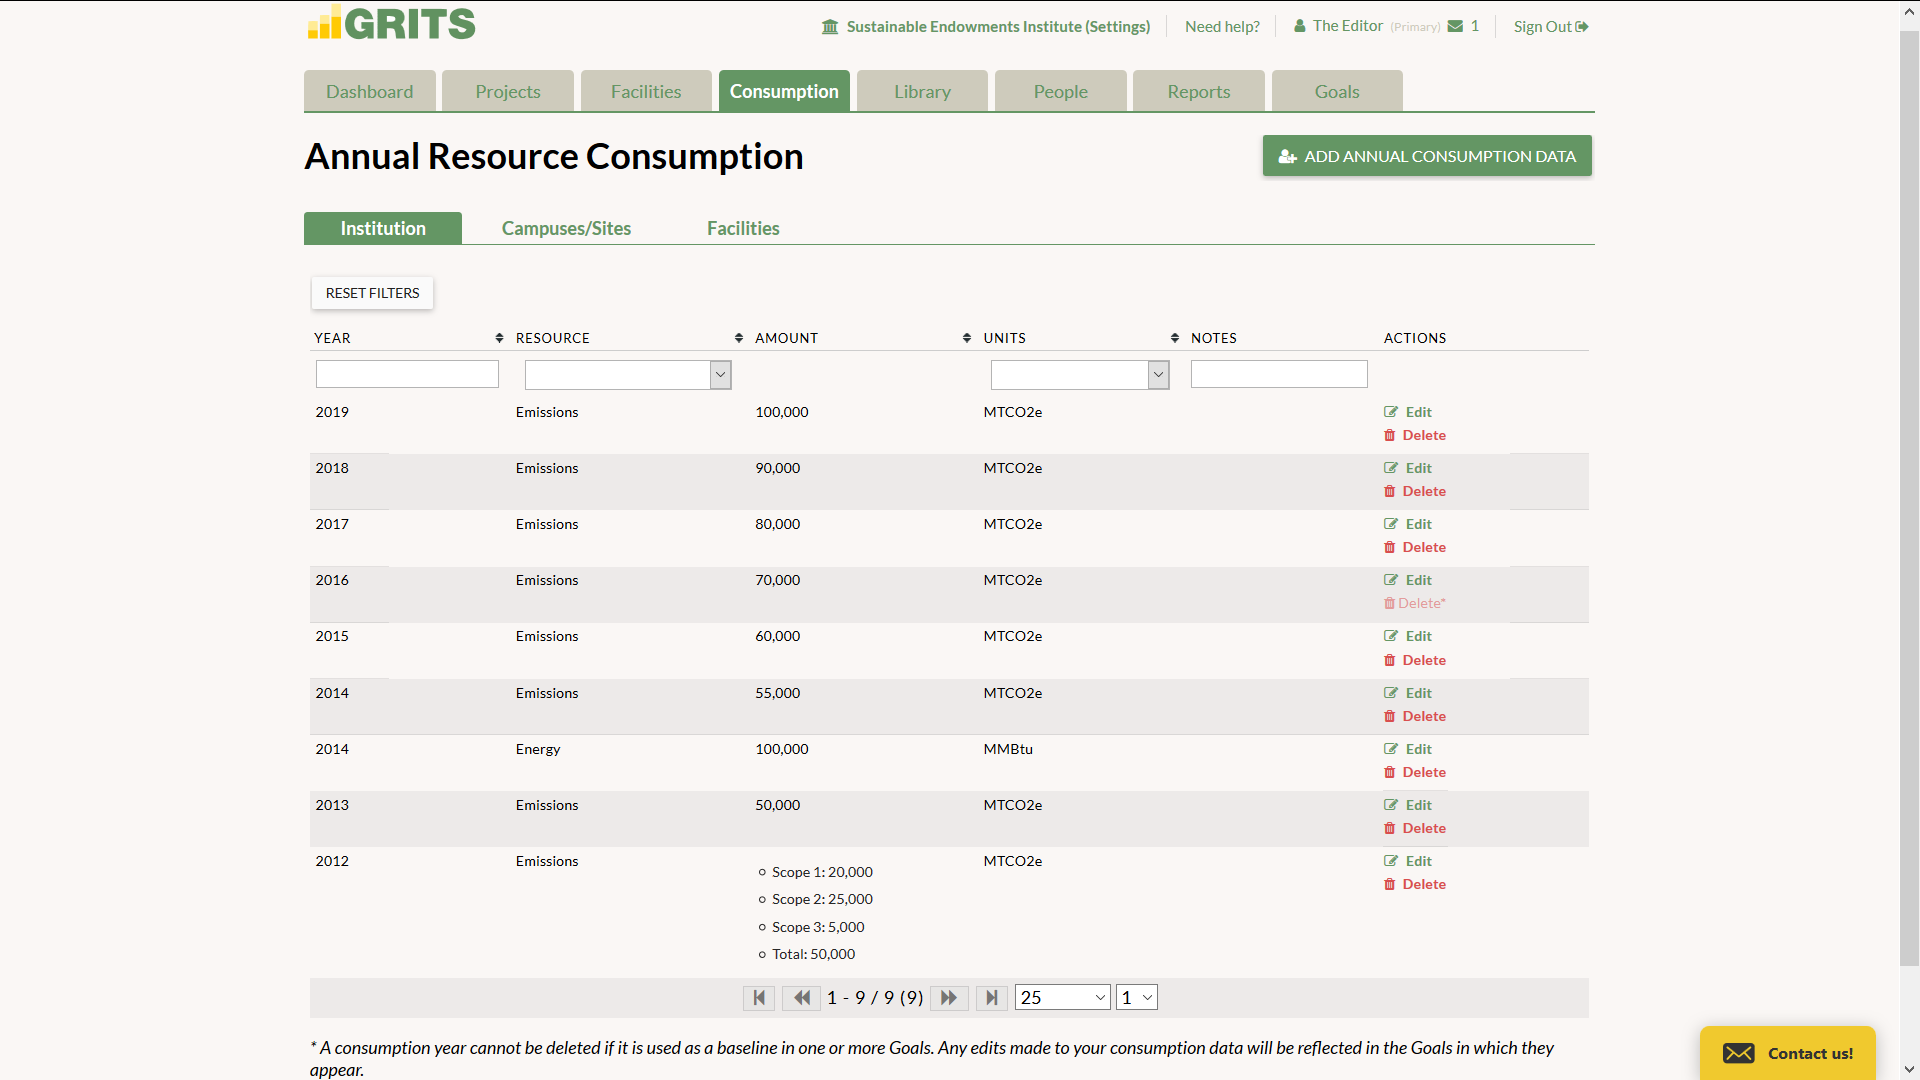
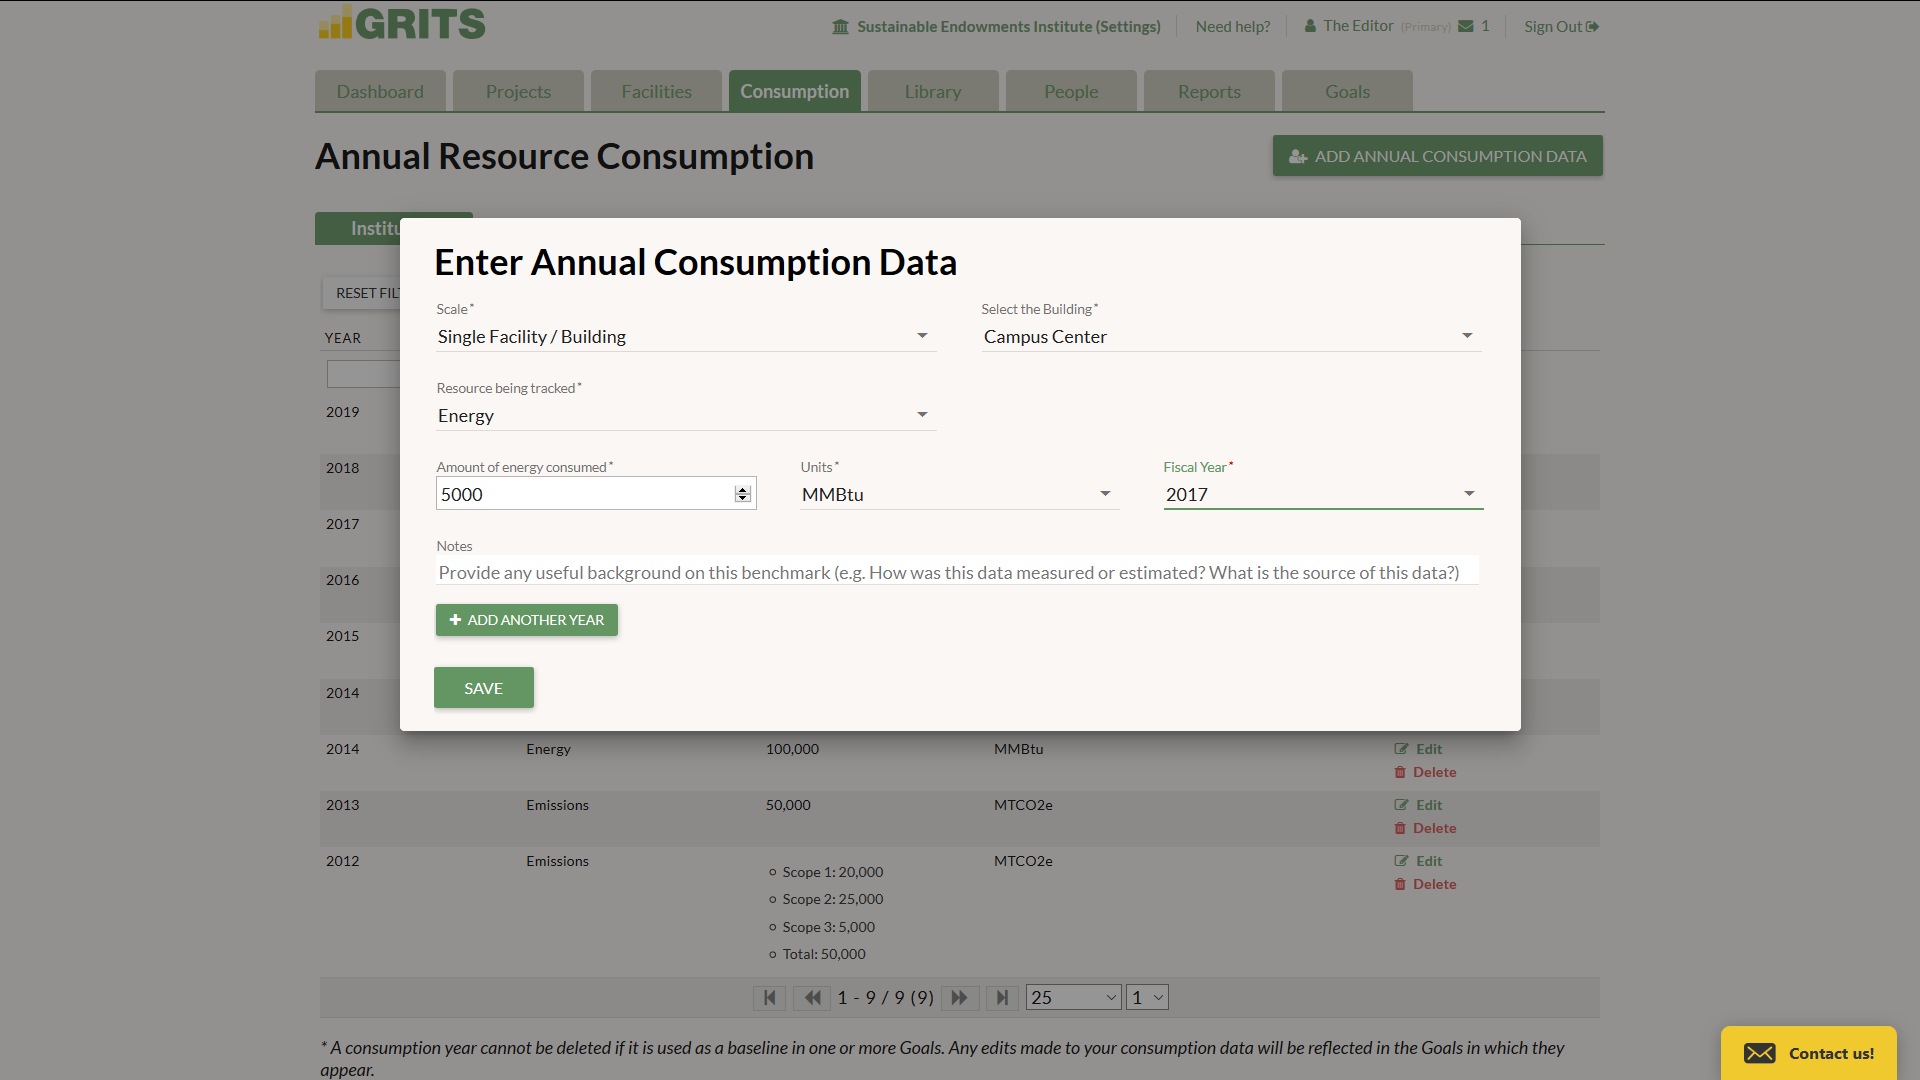
The Consumption tab is where you can enter your carbon emissions inventory as well as energy and water consumption and waste production data.
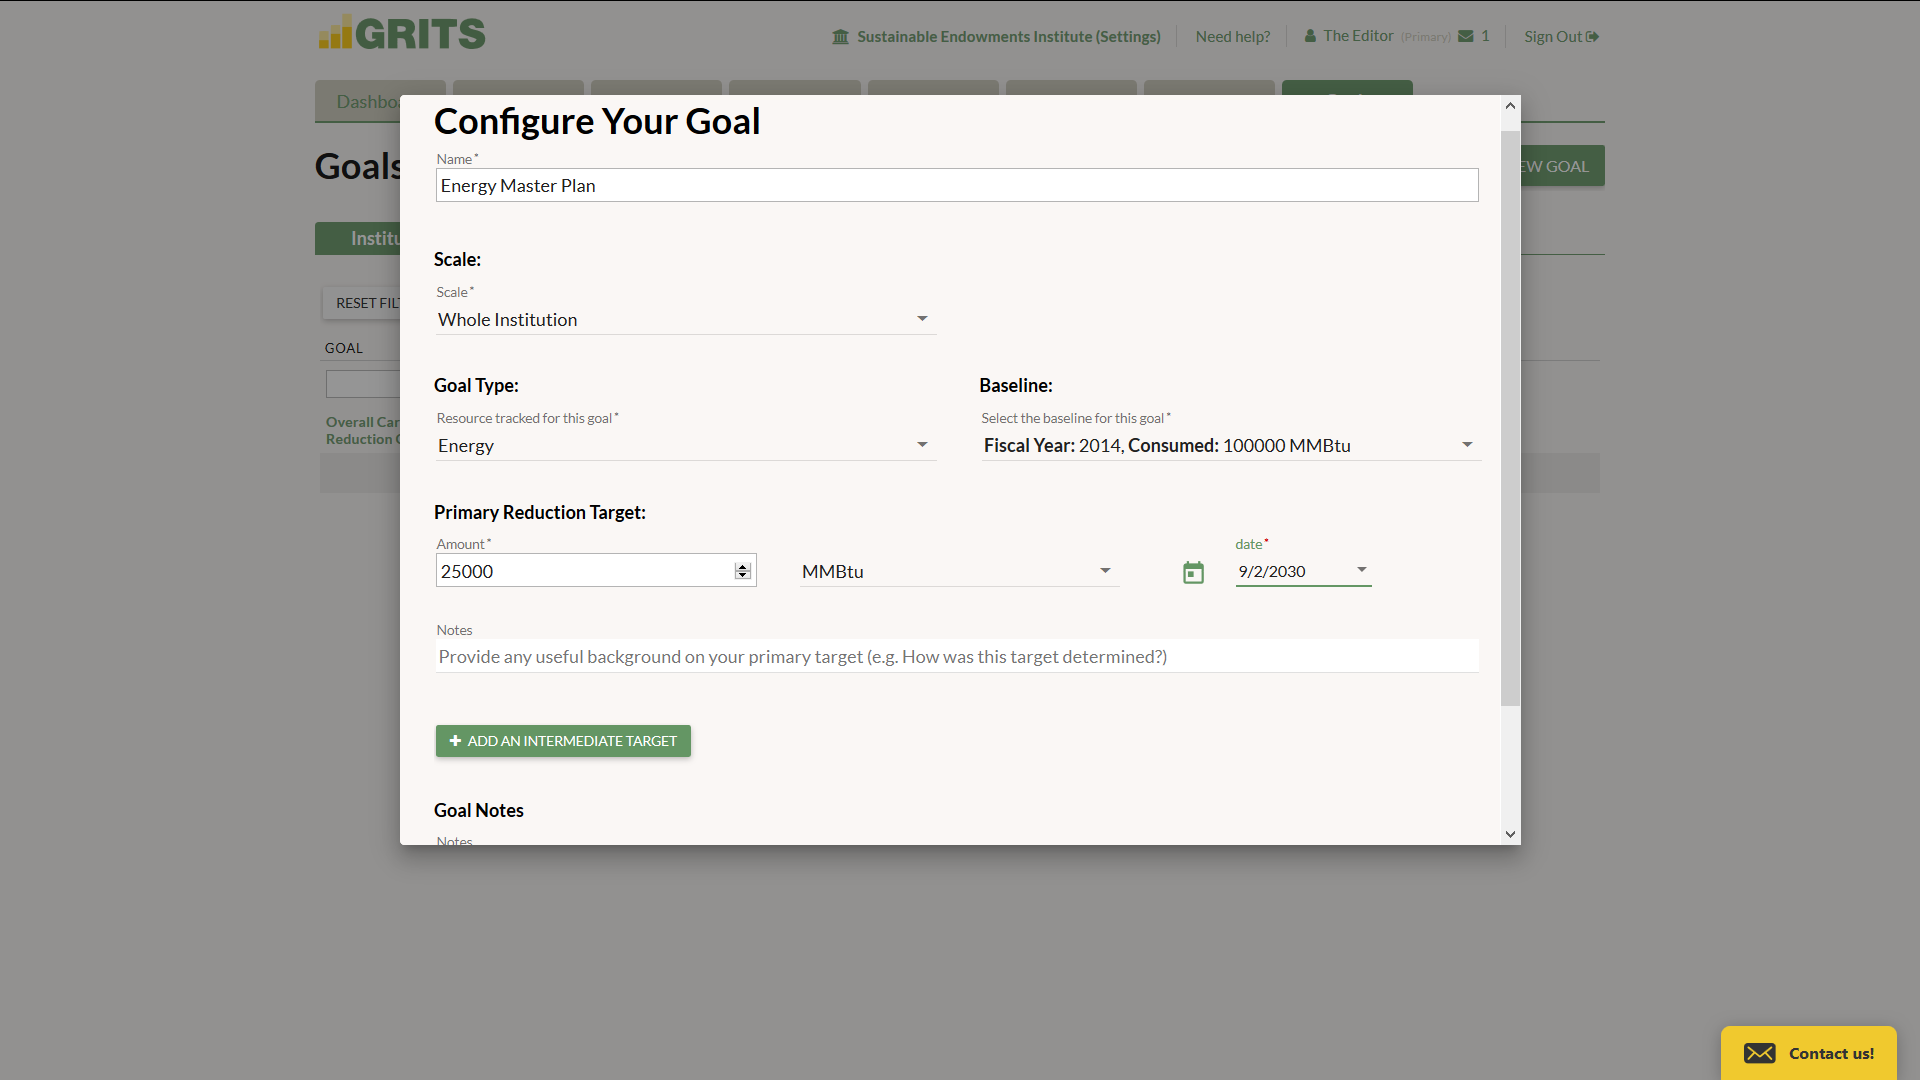
Goals Tab
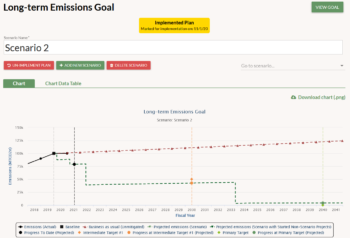
The Goals tab is where you can set up a resource reduction task--reducing emissions, energy and water consumption, or waste production from a baseline amount to a target in the future. Add intermediate targets to help you stay on track.
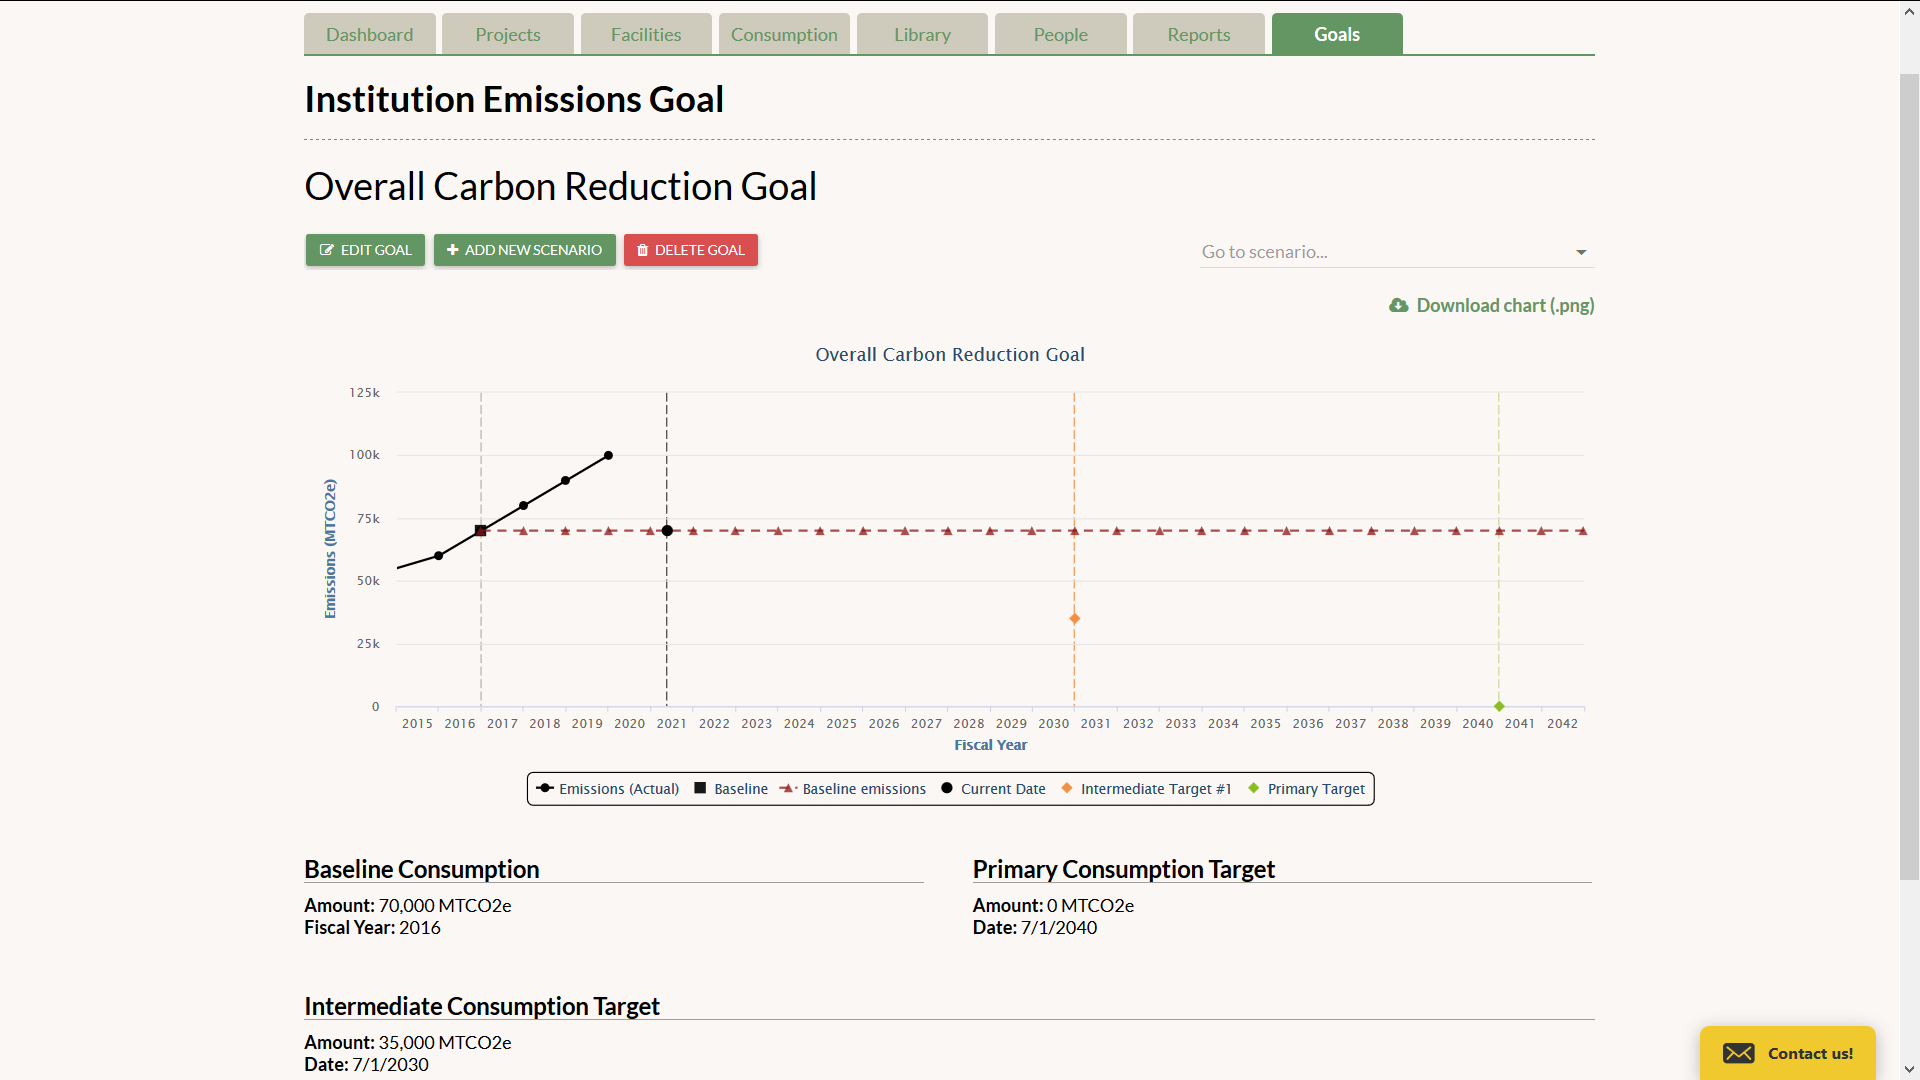
Goal Page
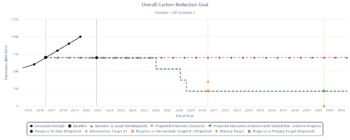
The Goal page is where you can visualize the parameters of the goal you created in chart form.
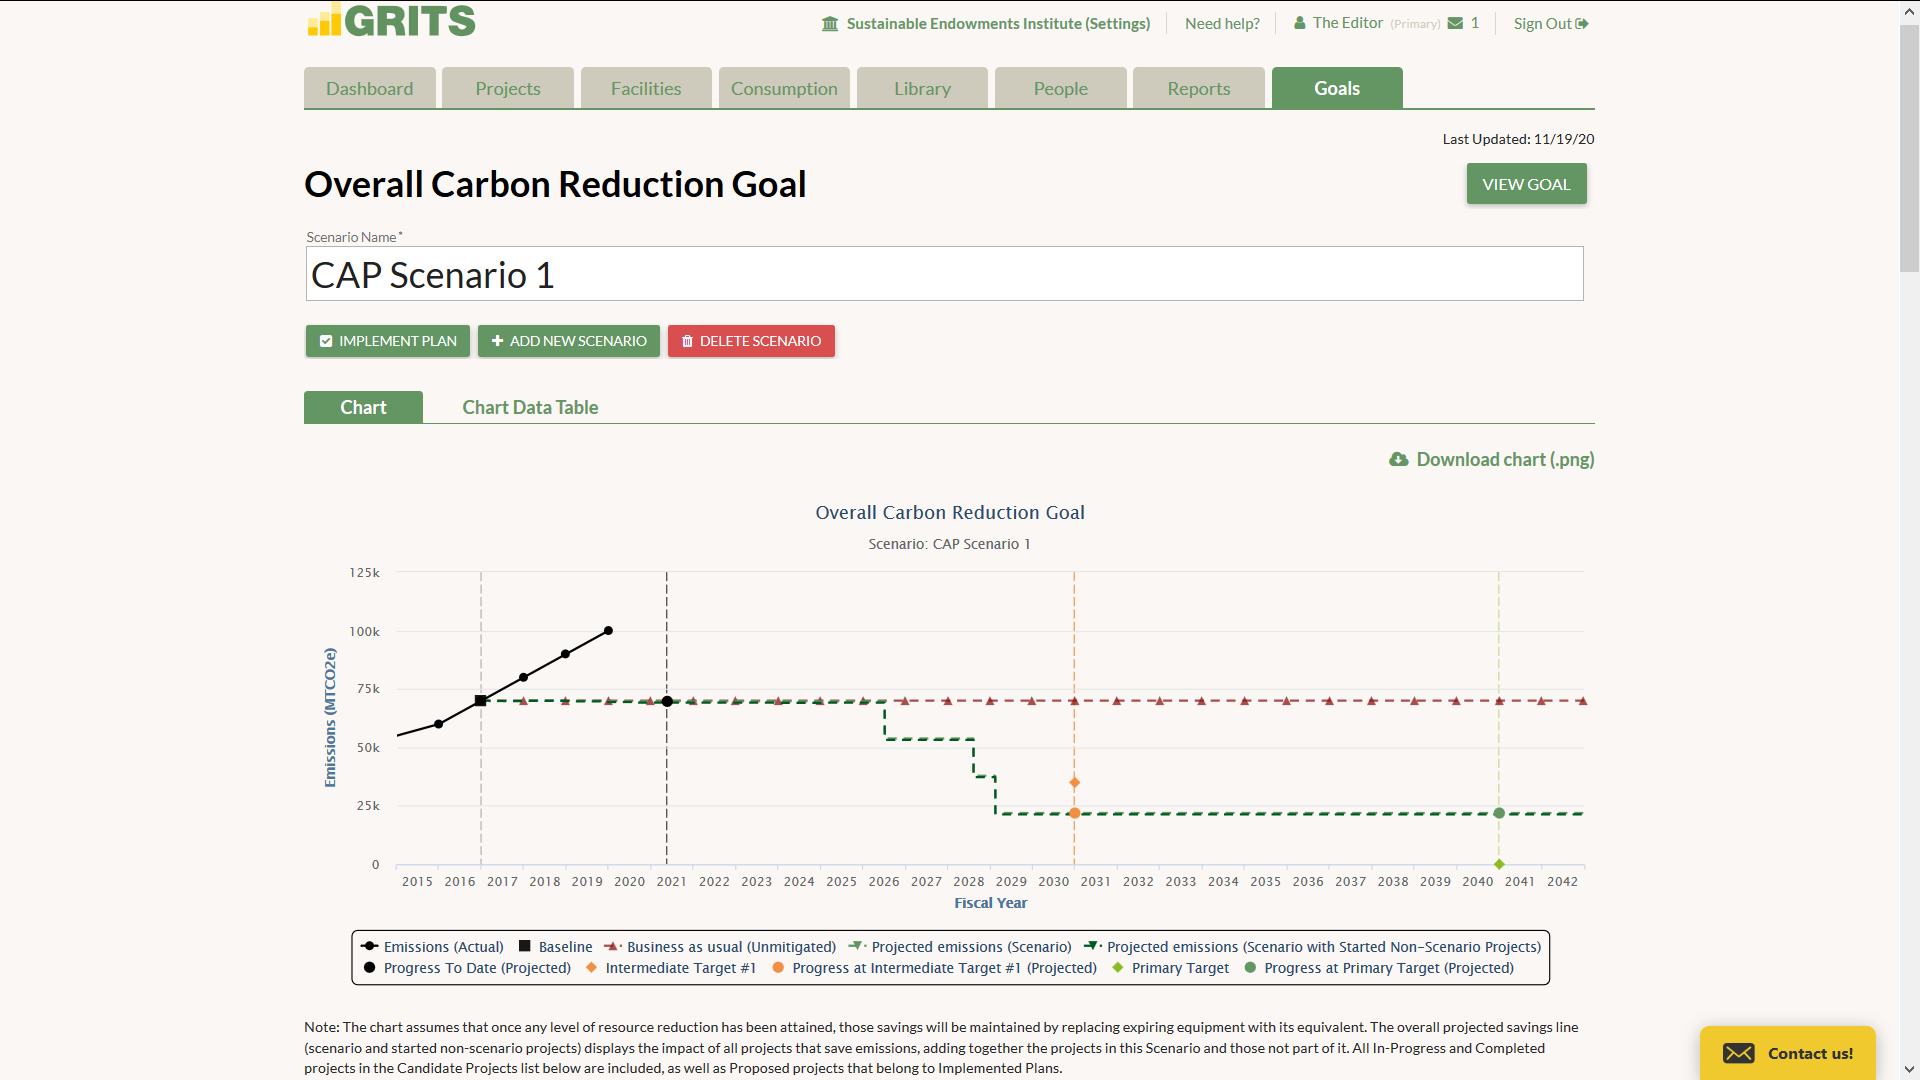
Scenario Page
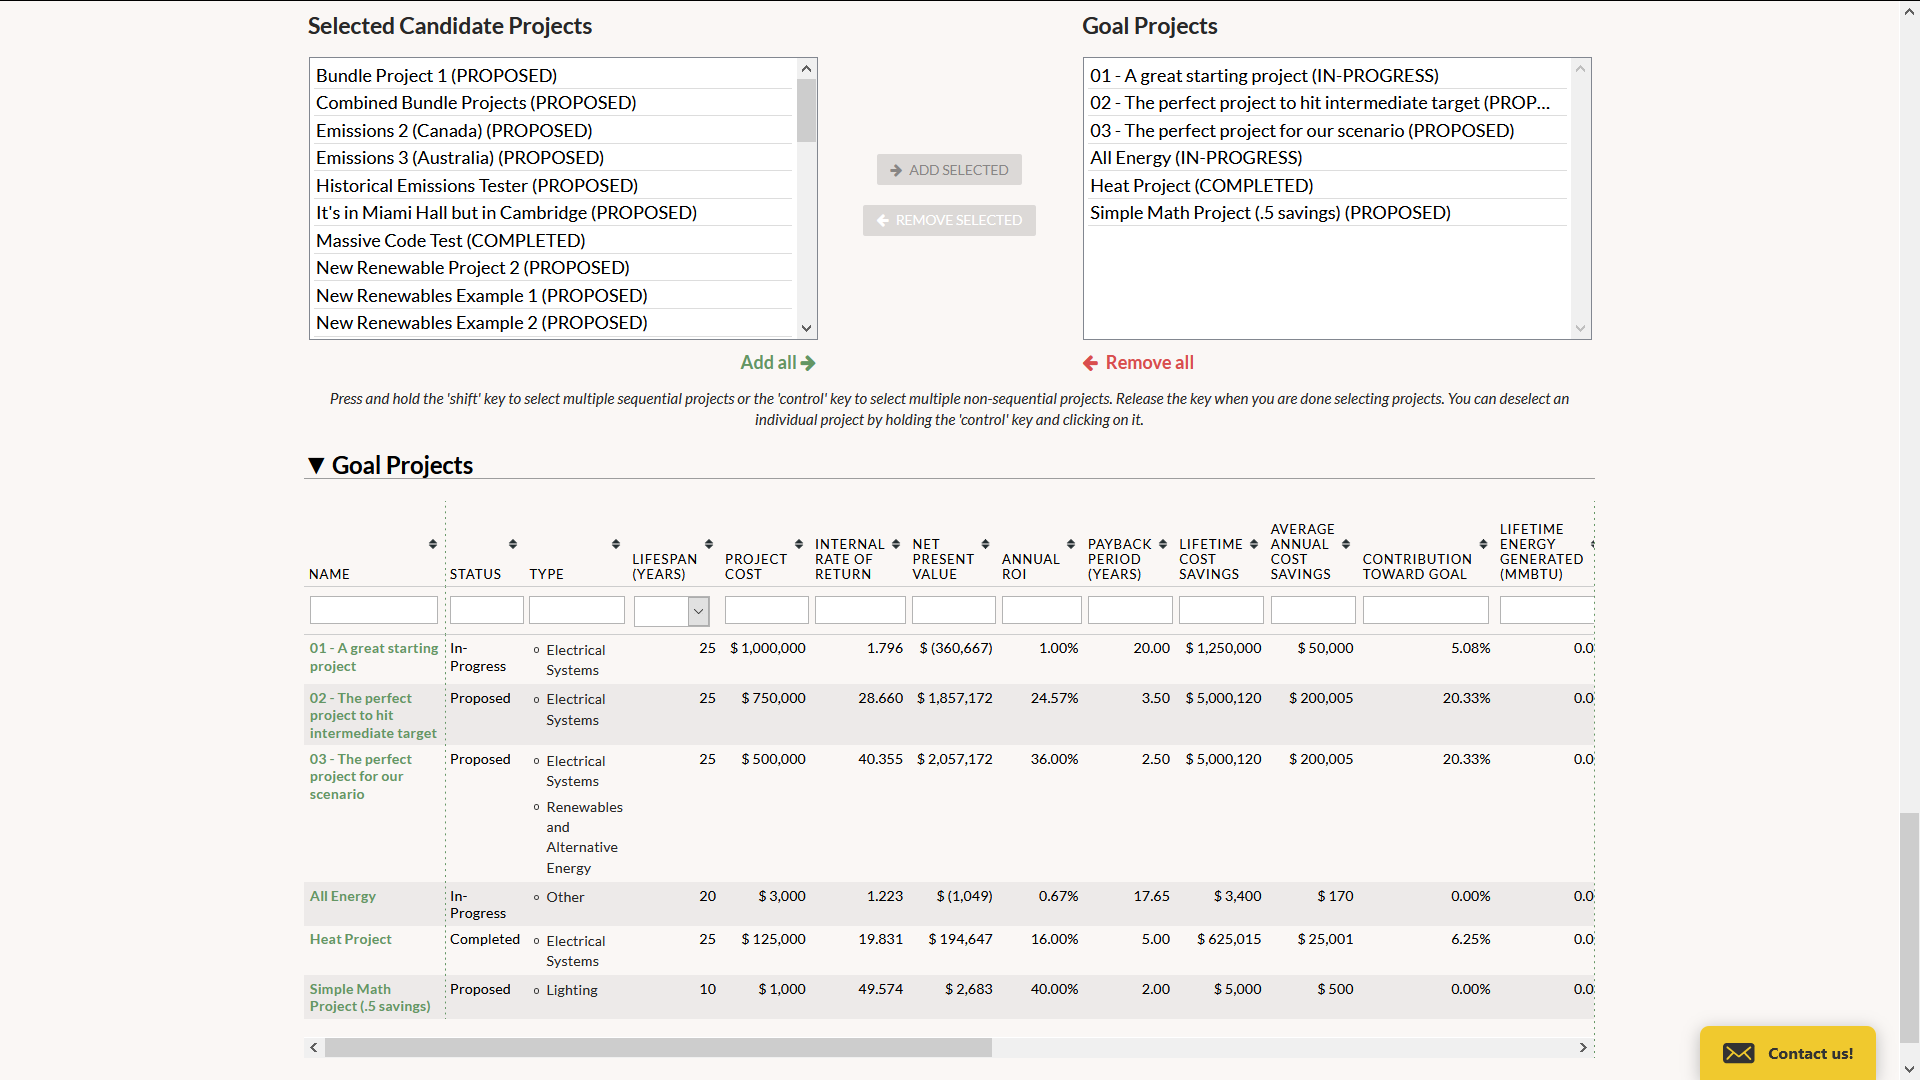
On the Scenario page you can quickly develop detailed climate action plan models or track an existing plan’s impacts by assembling your projects into resource reduction scenarios.
Announcing GRITS 2.0!
Announcing GRITS 2.0!
We are excited to launch GRITS 2.0, which includes a host of new sharing features (project-level sharing, a Public Library, and an embeddable Public Dashboard), integration with EPA’s Portfolio Manager tool, currency conversion, and several other additions.
Log in to GRITS now to see these new features in action!
Expanding the GRITS Universe
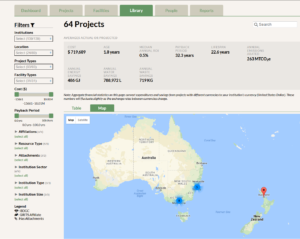
Two new locations have been added to GRITS—Australia and New Zealand! We welcome several new users, including Australia's foremost research universities: the Group of Eight. For all other users, you can use the location filter or the map in the Library to find projects completed by these institutions to compare against your own.
Custom Currencies
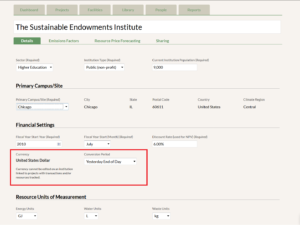
As GRITS' geographical location expands, so has the need for different currencies. All GRITS institutions are now configured to enter financial data in their country's currency, and GRITS converts to your own currency when you view projects in the Library from different countries. You can view your institution’s currency on the Settings page.
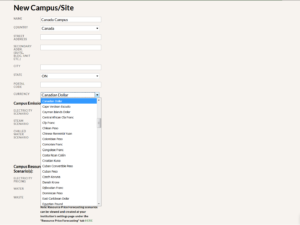
If your institution has campuses that operate outside of your country, you can also customize the currency of each campus and make it the default for all projects linked to that campus.
View campus-level savings graphs
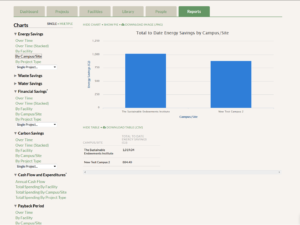
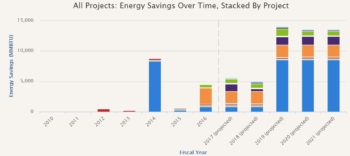
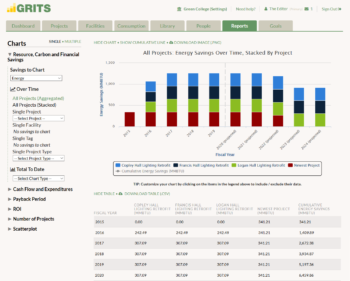
If your institution oversees multiple campuses/sites, you're now able to generate campus/site-specific graphs in the Reports tab. Use this option to see the energy, financial, and carbon savings achieved for each location's group of buildings.
Import facilities from Portfolio Manager
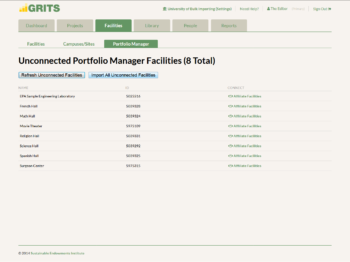
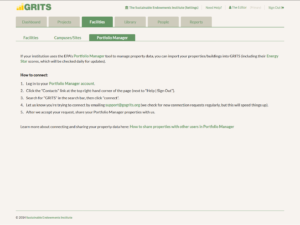
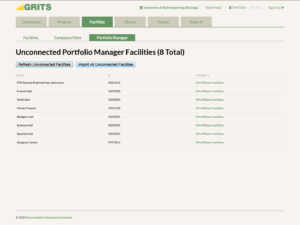
If you use the EPA's Portfolio Manager tool to track building data, you can now import those buildings and their basic characteristics into GRITS. You can find the new "Portfolio Manager" sub-tab under the Facilities tab, where there are instructions for connecting your account to GRITS. After sending a successful connection request and sharing your facility information, you can choose to import buildings into GRITS one-by-one or in bulk—saving significant time.
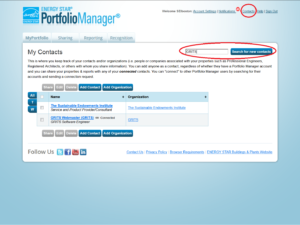
Step 1: Log into your Portfolio Manager account.
Step 2: Click the "Contacts" link at the top right-hand corner of the page (next to "Help | Sign Out").
Step 3: Search for "GRITS" in the search bar, then click "connect."
Step 4: Let us know you’re trying to connect by emailing support@gogrits.org (we check for new connection requests regularly, but this will speed things up).
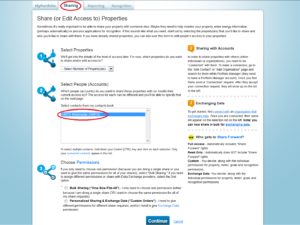
Step 5: After we accept your request, share your Portfolio Manager properties with us.
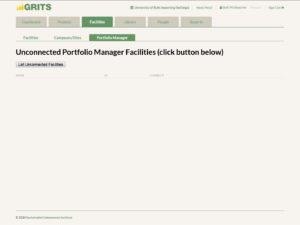
You will now be able to click the “load unaffiliated facilities” button in the “Portfolio Manager” sub-tab under the Facilities tab in GRITS.
Click the “Import All Unconnected Facilities” button to import all buildings from Portfolio Manager. You can also use the “Affiliate Facilities” button to import individual buildings, and choose to create a new facility in GRITS or merge data from Portfolio Manager with an existing GRITS facility.
Download facilities data
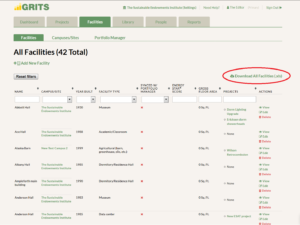
You're now able to download a spreadsheet all of your facility information from GRITS, including building name, type, and location. If you don't currently use the EPA's Portfolio Manager tool but plan to, you can use this spreadsheet to upload building data to the tool from GRITS.
Public-facing features
GRITS now has several features which enable users to share their project data with the public.
Project Sharing:
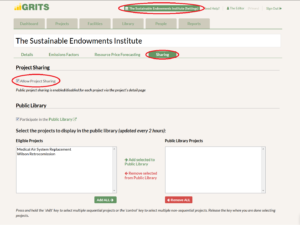
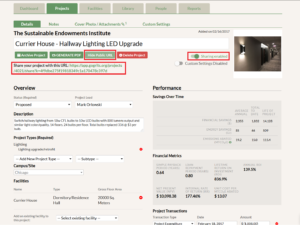
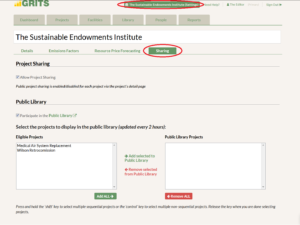
Choose to share individual projects with peers, administrators, or others who don't have access to GRITS. Project-level sharing is enabled by default for your institution (toggle on the Settings page, under the “Sharing” sub-tab), and you can start sharing individual projects by switching it on within each Project Detail page.
Flipping the sharing switch on your Project Detail page will reveal a customized link to your project that can be given to others, even those without access to GRITS, and can be switched off as desired. When at least one project is enabled for sharing, a new filter will appear on the Projects tab allowing you to isolate your sharing-enabled projects.
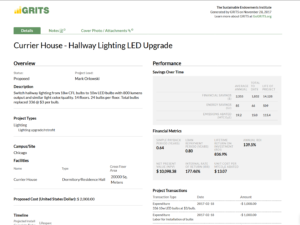
Clicking the public URL will bring you to the public project page.
Public Library:
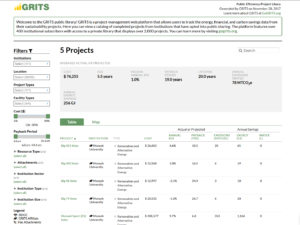
Choose to share your completed projects in a library visible to the public. Display your data and project achievements beyond GRITS, inspire others with ways to make their operations more efficient, and raise the profile of your institution.
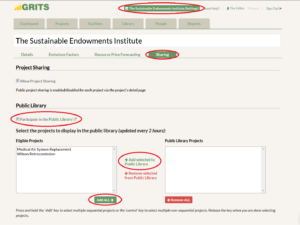
The Public Library is enabled by default for your institution (toggle on the Settings page, under the “Sharing” sub-tab), and you can start sharing individual projects by moving them from the Eligible Projects column to the Public Library Projects column. The projects will appear in the Public Library in two hours.
Anyone can access the Public Library at: https://app.gogrits.org/library/public
Public Dashboard:
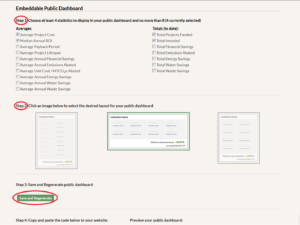
Design your own custom dashboard with several GRITS metrics that you can embed into your institution's website. Navigate to the Settings page and the “Sharing” sub-tab, then scroll down to the Public Dashboard section.
Choose between four and eight metrics that you would like to display in the Public Dashboard. These are calculated from the projects marked as Completed unless otherwise stated. Then select the preferred layout. Finally, click the “Save and Regenerate” button.
A preview of your Public Dashboard is shown below. Copy the code to the left and embed it into your website to display the Dashboard and share the impact of your GRITS projects.
Introducing GRITS 1.7!
Introducing GRITS 1.7!
Check out the new updates in GRITS 1.7, including custom emission scenarios, custom resource price forecasting, the ability to manage multiple campuses and locations, geolocation of facilities and campuses, viewing projects in your peer networks, a new chat feature, and cover photos for your projects.
Log in to GRITS now to see these new features in action!
CUSTOM EMISSIONS (CE) SCENARIOS
You can now create custom emissions factors for electricity, steam, and chilled water (the three resources that are generated from potentially different mixes of fossil fuels or renewables). Scenarios are created or deleted on the Settings page, under the “emissions factors” tab. You can also view default emissions factors for the three resources here. For institutions with multiple campuses in different locations, you’ll have a different default electricity emissions factor for each location. Steam and chilled water defaults are the same for all locations.
CE scenarios can be applied via a campus or on individual projects. A CE scenario can be set on a campus by clicking to “edit” the campus. This scenario will apply to all projects linked to that campus and is automatically enabled.
A CE scenario can be set on an individual project under the “custom settings” tab on the Project Detail page. To apply it, click to enable emissions settings under the “custom settings” tab and then flip the switch on the “details” tab to “enable custom settings.” Choosing “GRITS default” is also possible on the “custom settings” tab, and will allow projects that are currently affected by a campus-based CE scenario to revert to default emissions factors. Scenarios can be set for all three resources simultaneously.
CUSTOM RESOURCE PRICE FORECASTING
You can now create custom resource price forecasts that show how your resource price and financial savings would change under a given rate of change or set price over various years. A scenario can be created for all resources. Scenarios are created or deleted on the Settings page under the “resource price forecasting” tab.
They are applied in the same way as CE scenarios.
This is how a resource price forecast looks for institutions without a revolving fund:
This is how a resource price forecast looks for institutions using GRITS in revolving fund mode:
CAMPUSES
Do you operate on more than one campus? You can now group your facilities into different campuses and apply custom emissions and resource price scenarios to all projects associated with each campus. This feature is especially useful if you work across a school-wide system or operate in multiple locations.
Create and edit campuses in the Facilities tab. All projects must be linked to a campus. One campus has been created for your institution and each of your projects are attached to it.
GEOLOCATION OF FACILITIES AND CAMPUSES
Both facilities and campuses are geolocated via Google Maps based on their city, street address, or postal code. If no information is entered for a facility, the location of the campus is used to geolocate it. The map appears under the Facilities tab when viewing or editing a facility or campus. You can manually move the pin that specifies the facility or campus’s location or edit the latitude and longitude coordinates below the map for even greater precision.
The Projects tab and Project Library now have the option to turn the table into a map. On the Projects tab, the map displays the location of each project based on the facility it’s linked to. Projects without facilities will not appear on the map. Clicking on the pin displays the name of the facility with the number of projects of each type, such as proposed, in-progress, and completed.
In the Project Library, the map shows the location of each campus. Since all projects are linked to a campus, all projects in the Library appear on the map. Clicking on the pin displays the institution’s name and campus address, along with the number of projects there. Anonymous institutions cannot see the map and their projects do not show up on the map for non-anonymous institutions.
VIEW PROJECTS WITHIN YOUR PEER NETWORK
Does your institution belong to a peer network like APPA or the Climate Leadership Network? If so, you can now filter by this affiliation in the Project Library to see exactly what your peer institutions have been up to. Just click to only view projects within your network under the “Affiliations” filter in the Library.
CHAT WITH US ONLINE!
Introducing the GRITS chat! When you’re logged into GRITS, you can start a conversation with GRITS staff by clicking the “Contact us!” button on the bottom right-hand corner of the screen. During business hours (EST), we’re available live. At other times, we’ll get back to you within the next business day.
COVER PHOTOS
You can now add a cover photo to your projects and display the area you’ve been working on. Upload a photo to the “attachments” section of the Project Details page or use an existing photo that you have already uploaded, and click to display it as a cover photo on the front page of your project. Clicking on the photo zooms into a larger version. If the attachment is marked “private” and then made into a cover photo, only users at your institution can view it.
Let us know if you have any questions about the new features or if you have ideas for future features you would like to see in GRITS! Contact us at support@gogrits.org.
Free GRITS Access for APPA Schools
Free GRITS Access for APPA Schools

Since 2016, the Sustainable Endowments Institute (SEI) and APPA have had a partnership that provides all APPA members with free access to GRITS. GRITS is a project-management platform that allows users to track and analyze the energy, financial, and carbon savings data from their energy- and resource-efficiency projects, as well as access a library of more than 3,000 projects completed by other GRITS users across the U.S. and Canada. (See a preview by visiting the GRITS Public Library.)
With this free version open to APPA members, users can:
- Access the GRITS Dashboard, which shows a snapshot of your project portfolio’s energy, financial, and carbon savings.
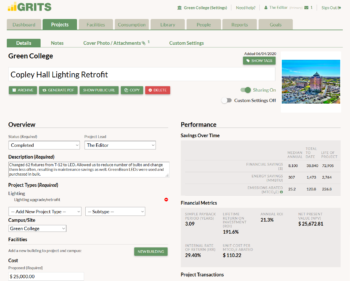
- Access the Project Details page to track project-level details, including project type, cost, relevant transactions, performance, and measurement and verification.
- Analyze custom groups of projects, including those that are proposed, in-progress, or completed.
- Use a suite of features called GRITS Goals to develop and track climate and energy master plans.
- View a limited version of the GRITS Project Library, which allows for filtering through projects from other institutions by project type, project cost, payback period, region, and more,
- Save and track up to 5 projects with unlimited user log-ins.
GRITS Unlimited has even more features (see below) and is available to APPA members at a special discounted rate. Access to GRITS Unlimited also includes the additional benefit of having SEI staff enter your existing project data, helping you effortlessly get started with using GRITS.
With GRITS Unlimited, users can access all the same features as the free version (above), as well as:
- The ability to enter an unlimited number of projects into the platform.
- The full version of the GRITS Project Library, which allows you to view in-depth project data from other institutions including detailed energy, financial and carbon performance data.
- The Microsoft Excel export feature to export all of your project data with one click.
- The Reports feature, allowing you to create and print customized graphs and charts based on your data, perfect for presentations on your projects.
All interested APPA institutions will receive 14 days of GRITS Unlimited at no cost. After 14 days, your account will be transitioned to the free GRITS-APPA version, unless you choose to upgrade to GRITS Unlimited. To get started using GRITS, please complete the brief form below:
Cleveland Clinic Launches Largest Green Revolving Fund in Healthcare
Cleveland Clinic Launches Largest Green Revolving Fund in Healthcare
$7.5M Fund Will Drive Energy Efficient Projects In Health System
Tuesday, May 10, 2016, Cleveland, OH: Cleveland Clinic announced the establishment of a $7.5 million Green Revolving Fund (GRF) – the largest established fund of its kind in the healthcare industry – during the national Better Buildings Summit in Washington, D.C.
In addition to being the largest green revolving fund among U.S. healthcare systems, Cleveland Clinic’s $7.5 million annual commitment is one of the largest in any business sector nationally.
Green revolving funds invest in energy efficiency projects to reduce energy consumption while reinvesting the money saved into future projects. As projects pull money from the fund, it is replenished by reinvesting tracked savings from reduced energy consumption, in addition to any rebates received.
“The establishment of this fund strengthens Cleveland Clinic’s commitment to reducing our energy usage and serves as a catalyst for future projects to further reduce our impact on the environment,” said Jon Utech, senior director for Cleveland Clinic’s Office for a Healthy Environment. “As a leader in healthcare, we are continually looking for ways to improve the health of the communities we serve and reduce our operating costs in order to make care more affordable for our patients.”
This dedicated fund will help drive Cleveland Clinic’s continued commitment to energy conservation and overall sustainability, including the goal to reduce energy intensity by 20 percent by 2020 as part of President Obama’s Better Buildings Challenge. Through the end of 2015, Cleveland Clinic has reduced its energy demand by 12.3 percent as part of this challenge.
Several key components to Cleveland Clinic’s early success in the Better Buildings Challenge include: improving the energy efficiency of its existing buildings by optimizing building systems; making targeted reinvestments; utilizing ENERGY STAR-rated lighting appliances and equipment; implementing an industry-leading LED lighting retrofit strategy, as well as numerous other energy reduction projects and programs.
“We are honored to welcome the Cleveland Clinic to the Billion Dollar Green Challenge and are excited about their commitment to developing the largest green revolving fund in the healthcare field,” said Mark Orlowski, Executive Director of the Sustainable Endowments Institute. “We’re enthusiastic that more hospitals will follow their leading example and commit to investing in deeper building energy efficiency through self-managed green revolving funds to reap significant financial and environmental benefits.”
The establishment of the green fund is part of the Sustainable Endowments Institute’s Billion Dollar Green Challenge. The challenge encourages colleges, universities, and other nonprofit institutions to invest in self-managed green revolving funds, with the goal of creating a combined total of one billion dollars in funding.
To date, 57 institutions have committed a total of $117 million to energy efficiency upgrades by developing green revolving funds as part of the Billion Dollar Green Challenge.
For more information on Cleveland Clinic’s energy conservation and sustainability efforts, visit Clevland Clinic’s Office for a Healthy Environment. For more information on the Sustainable Endowments Institute’s Billion Dollar Green Challenge, visit GreenBillion.org. For Cleveland Clinic inquiries, please email Angie Smith, 216.445.0265, smitha19@ccf.org

